Legacy Documentation
Desktop And Mini DBA Server
Legacy Documentation Home
alerts
analysisservicesalerts
analysisservicescpu
analysisservicesdashboard
analysisservicesdatabases
analysisservicesio
analysisservicessessions
azurealerts
azuredatabase
azuredatabasehealthcheck
azureindexes
azurelocks
azure security
azuresessions
azuresql
azuresqldatabase
azuresqldatabasedashboard
azuresqldatabases
azure sql server dashboard
azuretables
azurewaits
compare performance baseline
connections
cpu
custom sql server alerts
database
database query performance
databases
defaulttrace
dm exec query statistics xml
documentation
errorlog
files
gettingstarted
healthcheck database
healthcheck sql server
history active
history blocking
history data storage
history deadlocks
history files
history memory
history viewer
history waits
howtoperformancetuneazuresqldatabase
how to performance tune sql server
how to sql server performance tuning
how to sql server query tuning
indexes
Installation
io
License Support
locks
maintenance windows
options
performance history
security
server
servergettingstarted
Server Installation
server memory
serveroptions
serversecurity
servertroubleshooting
sql database memory
sql execution plan
sql extended event sessions
sql server activity
sql server alert configuration
sql server alerts
sql server database
sql server execution plan view
sql server index defrag jobs
sqlserverindexfragmentation
sql server index fragmentation
sql server index maintenance
sql server live query statistics
sqlserverqueryperformance
sql server query performance
sql server send slack alerts
sql server send teams alerts
sql server transaction log
sql server wait statistics
tables
tranlog
waits
webmonitorconfigure
webmonitorconnections
webmonitorcurrent
webmonitorcustom
webmonitorenterprise
webmonitorgettingstarted
webmonitorhistoric
webmonitorinstallation
webmonitorio
webmonitormemory
webmonitoroptions
webmonitoroverview
webmonitorsecurity
webmonitorwaits
wmi
The server waits screen is broken into Total \ Current \ Accumulating tabs. Each is similar in design as they all have a grid on the left with listed wait types, pie chart on the right reflecting the grids data and a wait details panel at the bottom.
Even though wait type names may not make it obvious what the wait type means the "Wait Information" section at the bottom of the screen may help uncover what each one signifies. Click a row in the grid to see it's wait details at the bottom of the screen.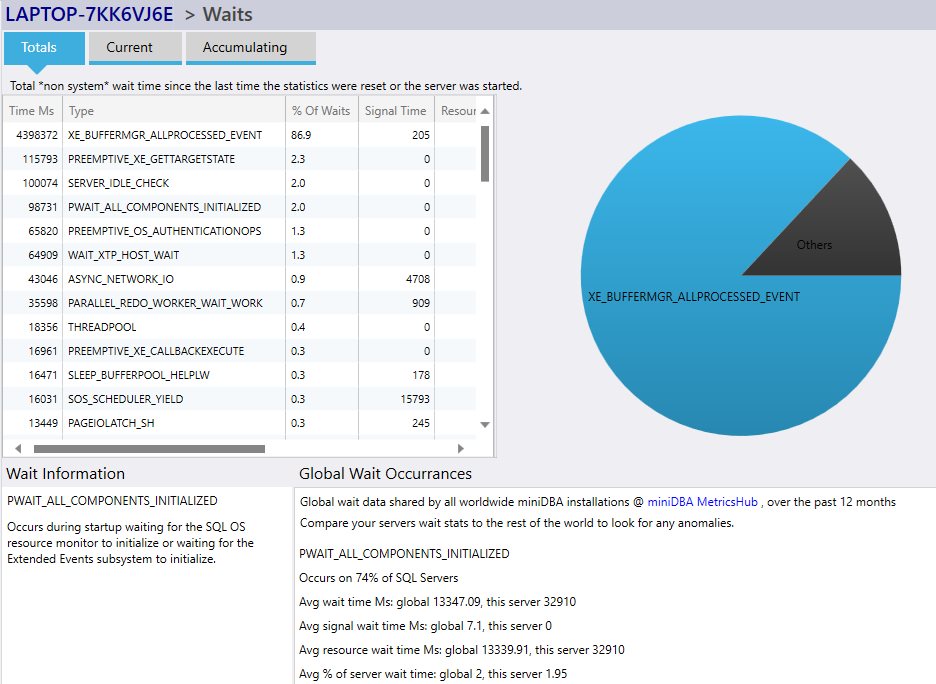
When a wait is clicked its details will be shown at the bottom of the screen. On the left is a description of the wait type, on the right are metrics that Mini DBA has gathered globally over all installations about that type under "Global Wait Occurrances"
Use these global figures to compare your wait type statistics against to see if you have any uncommon or particularly high value waits that may need attention.
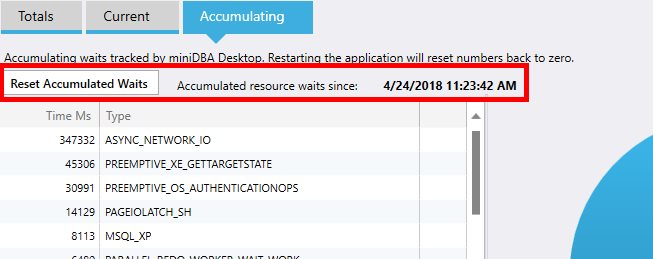
This functionality allows you to see what waits occurr during a certain workload. It is most useful when the server is very quite, possibly a development server and then run a workload you ae interested in, so no background wait types occur that you are not interested in, which may skew results.
Note that the monitored server is not asked for the waits information unless the waits screen is shown. This means any data shown as soon as you display the screen is as old as last time you viewed the waits screen.
Fresh data won't be got until the next server sample, how long that is depends on your settings.
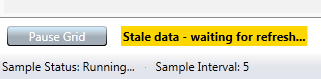
Until the fresh wait information is displayed on the screen you will see informational text telling you the current data is stale:
This functionality is available in the free single sql connection version of Mini DBA Desktop and above.
Totals
The Total tab shows all waits since the server was restarted. As this view refreshes the totals will slowly increase until the server restarts. This is a great view of how this particular SQL Server mostly operates and is a common starting point for performance tuning at server level. CPU, IO or memory contention can be identified quite easily here.Even though wait type names may not make it obvious what the wait type means the "Wait Information" section at the bottom of the screen may help uncover what each one signifies. Click a row in the grid to see it's wait details at the bottom of the screen.
When a wait is clicked its details will be shown at the bottom of the screen. On the left is a description of the wait type, on the right are metrics that Mini DBA has gathered globally over all installations about that type under "Global Wait Occurrances"
Use these global figures to compare your wait type statistics against to see if you have any uncommon or particularly high value waits that may need attention.
Current
The current tab displays the waits currently occuring. These are totally live and read every time Mini DBA samples the SQL Server. These are not accumulating metrics just point in time when sampled.Accumulating
The accumulating tab displays the waits since Mini DBA was started. Click the "Reset Accumulated Waits" button to reset the accumulaing waits to zero.This functionality allows you to see what waits occurr during a certain workload. It is most useful when the server is very quite, possibly a development server and then run a workload you ae interested in, so no background wait types occur that you are not interested in, which may skew results.
Note that the monitored server is not asked for the waits information unless the waits screen is shown. This means any data shown as soon as you display the screen is as old as last time you viewed the waits screen.
Fresh data won't be got until the next server sample, how long that is depends on your settings.
Until the fresh wait information is displayed on the screen you will see informational text telling you the current data is stale:
This functionality is available in the free single sql connection version of Mini DBA Desktop and above.