Legacy Documentation
Desktop And Mini DBA Server
Legacy Documentation Home
alerts
analysisservicesalerts
analysisservicescpu
analysisservicesdashboard
analysisservicesdatabases
analysisservicesio
analysisservicessessions
azurealerts
azuredatabase
azuredatabasehealthcheck
azureindexes
azurelocks
azure security
azuresessions
azuresql
azuresqldatabase
azuresqldatabasedashboard
azuresqldatabases
azure sql server dashboard
azuretables
azurewaits
compare performance baseline
connections
cpu
custom sql server alerts
database
database query performance
databases
defaulttrace
dm exec query statistics xml
documentation
errorlog
files
gettingstarted
healthcheck database
healthcheck sql server
history active
history blocking
history data storage
history deadlocks
history files
history memory
history viewer
history waits
howtoperformancetuneazuresqldatabase
how to performance tune sql server
how to sql server performance tuning
how to sql server query tuning
indexes
Installation
io
License Support
locks
maintenance windows
options
performance history
security
server
servergettingstarted
Server Installation
server memory
serveroptions
serversecurity
servertroubleshooting
sql database memory
sql execution plan
sql extended event sessions
sql server activity
sql server alert configuration
sql server alerts
sql server database
sql server execution plan view
sql server index defrag jobs
sqlserverindexfragmentation
sql server index fragmentation
sql server index maintenance
sql server live query statistics
sqlserverqueryperformance
sql server query performance
sql server send slack alerts
sql server send teams alerts
sql server transaction log
sql server wait statistics
tables
tranlog
waits
webmonitorconfigure
webmonitorconnections
webmonitorcurrent
webmonitorcustom
webmonitorenterprise
webmonitorgettingstarted
webmonitorhistoric
webmonitorinstallation
webmonitorio
webmonitormemory
webmonitoroptions
webmonitoroverview
webmonitorsecurity
webmonitorwaits
wmi
Mini DBA displays performance data either for live data or for historic data that has been saved every minute as Mini DBA monitors. This data is available for the following 30 days to go back and view. Details of where data is stored and expected data size on disk can be read about in Data Storage
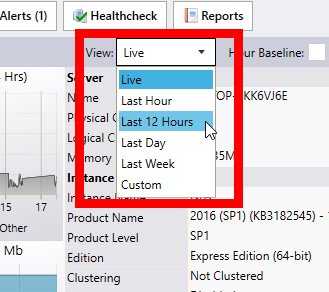
Either click the view dropdown at the top right of the sql server dashboard screen:
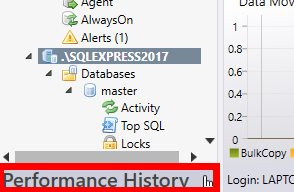
Or click the history button at the bottom left of Mini DBA:
Or right click a graph in the sql server dashboard:
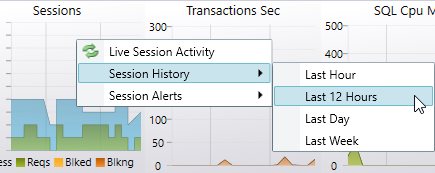
If selecting from the dropdown or graph context menu Mini DBA will load the historic data for the server you were viewing over the time period you selected.
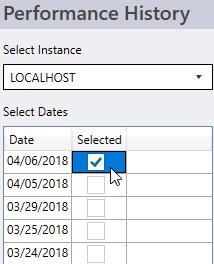
If you clicked the history button you will have to select sql server and dates(s) required to view. These lists will be comprised of every instance and date Mini DBA has ever logged on:
The screenshot belows shows an opened server history , displaying the main dashboard view. Notice the controls highlighted that control changing the data displayed.
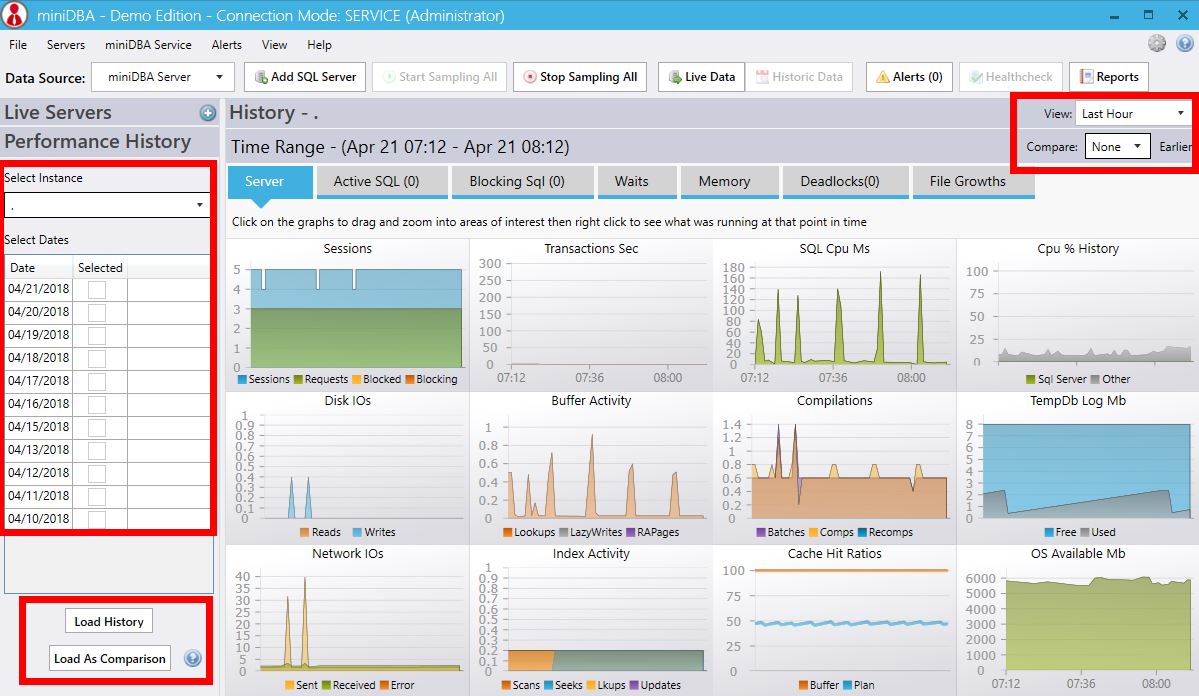
The "Load as Comparison" button and "Compare Earlier" dropdown are used to load secondary datasets to compare against the currently loaded performance baseline. Read more about comparing performance baselines
To get back to live data either click "Live Servers" at top left of screen or use the "View" dropdown in the top right and select "Live".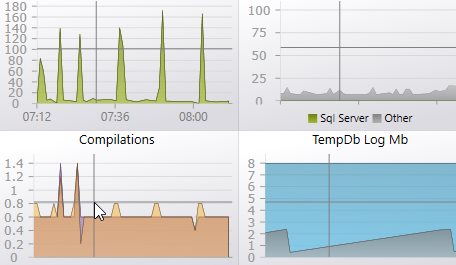
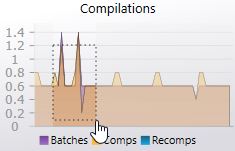
Zooming is also supported and is synchronized across all graphs simultaneously so you can dig into the data across all metrics. To zoom, either use your mouse wheel or drag your cursor across the section of a graph you are interested in. After highlighting the section the graph will zoom in. You can keep highlighting graph areas to continue to zoom in. To zoom out, right click and choose zoom out. Zooming out always returns you to the top level of data so you only need to select it once to fully zoom out.
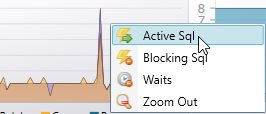
Right clicking a graph on the dashboard will also give you the option to go to Active/Blocking requests or Waits at the exact point in time your cursor is at.
The requests and waits are displayed in other tabs, whose data is loaded at the same time as the main performance dashboard. There are 6 other tabs in the performance history viewer that have individual displays of other historic data:
Loading Data
There are 3 ways to access historic performance data from the default live data view in Mini DBA Desktop.Either click the view dropdown at the top right of the sql server dashboard screen:
Or click the history button at the bottom left of Mini DBA:
Or right click a graph in the sql server dashboard:
If selecting from the dropdown or graph context menu Mini DBA will load the historic data for the server you were viewing over the time period you selected.
If you clicked the history button you will have to select sql server and dates(s) required to view. These lists will be comprised of every instance and date Mini DBA has ever logged on:
The screenshot belows shows an opened server history , displaying the main dashboard view. Notice the controls highlighted that control changing the data displayed.
The "Load as Comparison" button and "Compare Earlier" dropdown are used to load secondary datasets to compare against the currently loaded performance baseline. Read more about comparing performance baselines
To get back to live data either click "Live Servers" at top left of screen or use the "View" dropdown in the top right and select "Live".
Navigating Data
Notice in the screenshot the crosshairs in every graph. These are provided to help you easily compare the data in 1 graph at an exact time with data in all other graphs at that time. Moving your cursor around 1 graph will draw the same crosshairs in all graphs.
Zooming is also supported and is synchronized across all graphs simultaneously so you can dig into the data across all metrics. To zoom, either use your mouse wheel or drag your cursor across the section of a graph you are interested in. After highlighting the section the graph will zoom in. You can keep highlighting graph areas to continue to zoom in. To zoom out, right click and choose zoom out. Zooming out always returns you to the top level of data so you only need to select it once to fully zoom out.
Right clicking a graph on the dashboard will also give you the option to go to Active/Blocking requests or Waits at the exact point in time your cursor is at.
The requests and waits are displayed in other tabs, whose data is loaded at the same time as the main performance dashboard. There are 6 other tabs in the performance history viewer that have individual displays of other historic data: