Database Monitoring That Finds the Cause

Monitor SQL Server, PostgreSQL, MySQL, MariaDB, Oracle and Azure SQL from one browser Console

Keep the metrics, queries and alerts needed to explain slow databases and prevent repeat incidents

Monitoring built around your database platform

Start with the operational problems you need to solve, then use the same history, alerting and assisted investigation workflow across a mixed database estate.

Monitor

Monitor SQL Server, PostgreSQL, MySQL, MariaDB, Oracle and Azure SQL continuously. Use configurable alerts and history to catch availability, workload and resource problems before the evidence disappears.

Tune

Improve query speed using live and historical metrics, waits, sessions, deadlocks and execution plans. AI-assisted analysis helps turn the selected evidence into focused diagnostic steps.

Healthcheck

Run platform-specific health checks for configuration, capacity, security and maintenance risks. Use the browser Console to review findings across the estate and drill into the affected database.

See Mini DBA solving real database problems

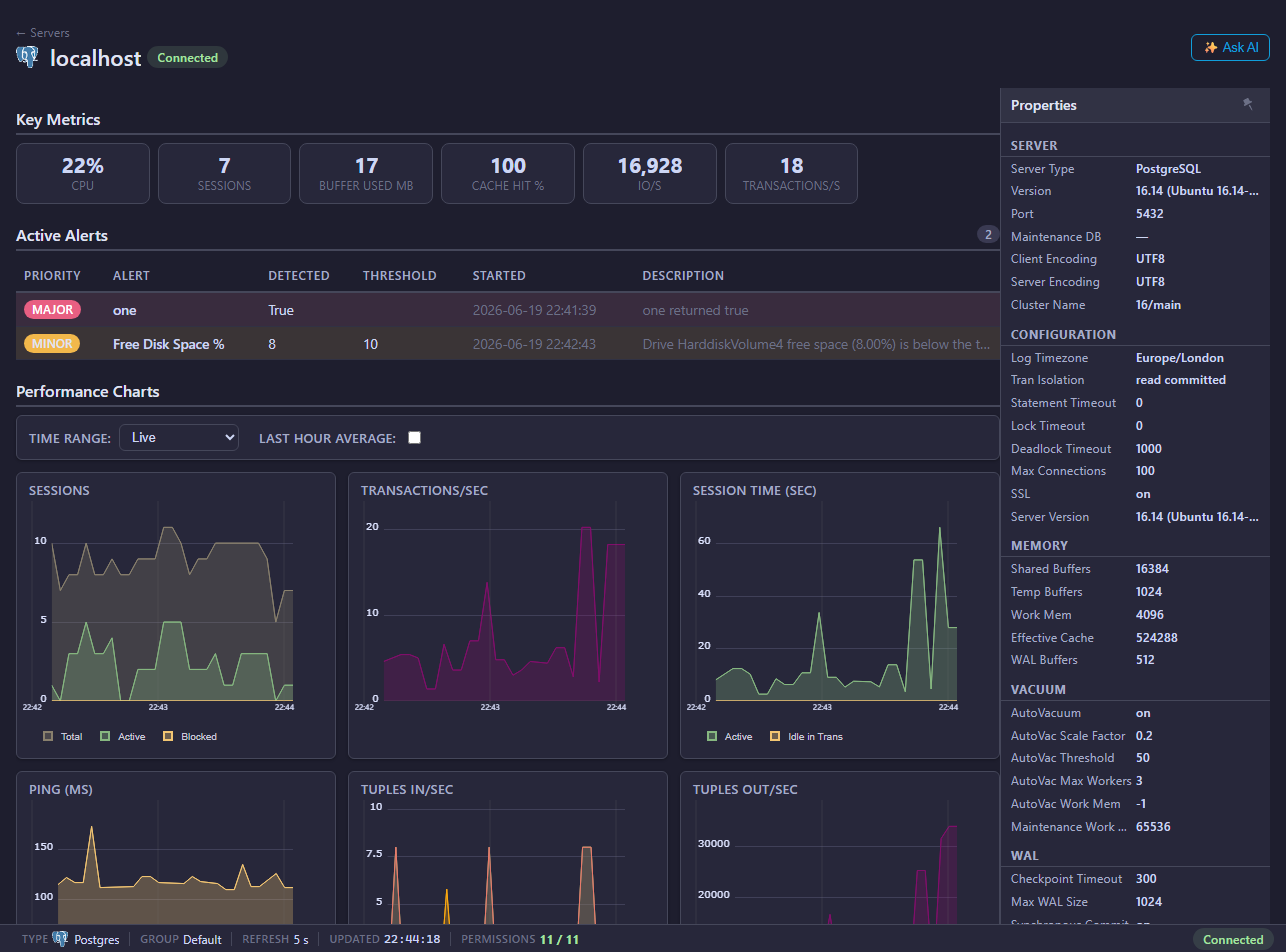
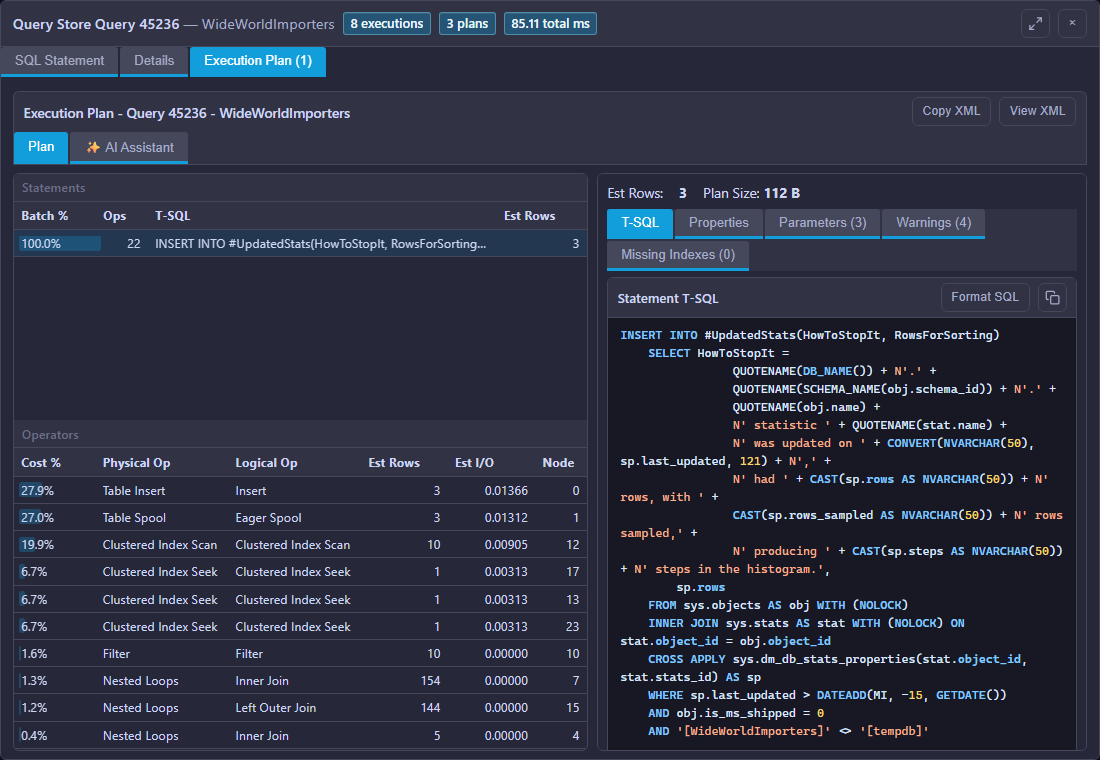
Move from estate health to the server, query, execution plan or alert that needs attention. Select a screenshot to view it full size.

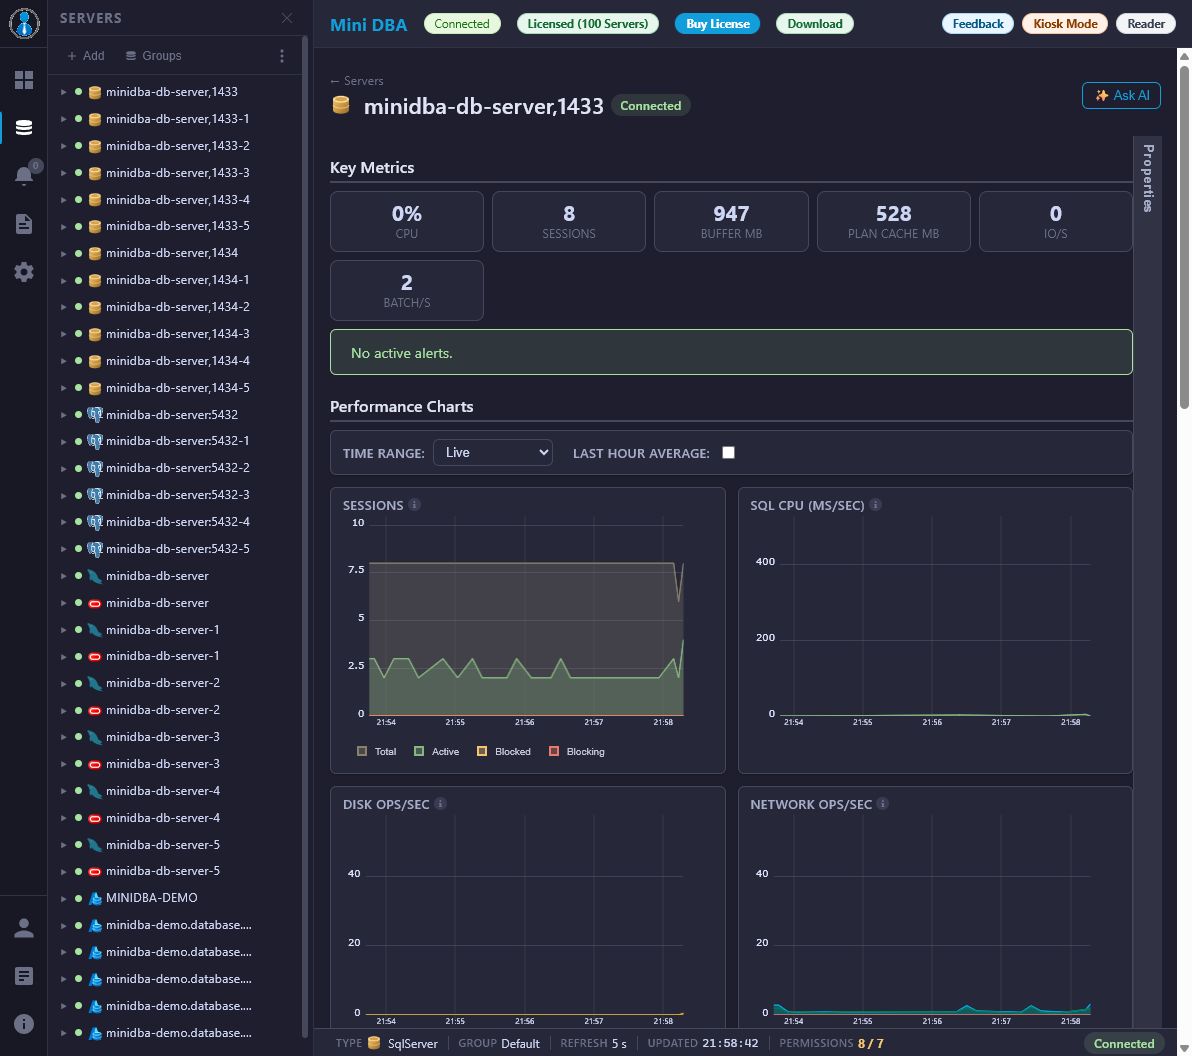
Browser Console

DBAs, developers and operations teams use one current browser interface for estate health, alerts, queries, plans and history.

Explore Features

Features

  • AI Assistant for performance, deadlock, alert and plan investigation
  • MCP Server for approved estate-wide AI questions
  • Live and historical metrics, queries, waits, alerts and health checks
  • Multi-platform and optional multi-site monitoring

Deploy your way

  • Install on Windows
  • Host on a suitable Linux virtual machine
  • Use supported container deployment
  • One Engine for most environments
  • Optional additional Engines for advanced multi-site estates
  • Free Community Edition for one monitored server

Monitoring evidence stays connected

The Engine collects continuously; the Console connects estate health to server and database detail; AI Assistant and MCP workflows help teams explore the same evidence at different scopes.

See Mini DBA now or install it for your own databases
Try the Online Demo Download Mini DBA
  • 40+ Performance Dashboards
  • 75+ Server & DB Health checks
  • Live SQL Queries/Sessions
  • Live Execution Plan Analysis
  • Live Query Statistics
  • Always On Replication Health
  • Elastic Pool use analysis
  • Total & Current Resource Waits
  • Compare Waits to Global Averages
  • Top/Slowest SQL (Speed, IO, CPU)
  • Query Load By CPU Core
  • Memory Performance
  • IO Performance by Files & Drive
  • Auto Capture of Default Trace Events
  • SQL Server Error Log Reader
  • Supports SQL Server 2008+, Azure SQL Database & Managed Instance
  • Configure & Raise Unlimited Alerts
  • Production & Development Alerts Presets
  • Create Custom SQL Healthchecks
  • Jira integration
  • Email Notifications
  • Slack Notifications
  • PagerDuty Notifications
  • Alert To Windows Event Log
  • Alerts Ignore Filtered Out Dbs
  • Alerts Show All Metrics When Raised
  • Always On Replica & Db Performance
  • Deadlock Detection & Analysis
  • Performance Monitoring
  • Compare your servers performance to community averages
  • Report Generation Tool (XLSX/CSV/PDF)
  • Index Use & Fragmentation Views
  • Scheduled Index Maintenance Jobs
  • Replay Historic Metrics Performance
  • Calendar View of SQL Agent Jobs
  • View SQL Agent Job Performance & History
  • View SSRS Performance & History
  • Remote Server Processes List (Task Manager View)
  • Unlimited Desktop/Web Clients
  • Team Workflow Supported (Comments on alerts)
  • Easy Licensing
Explore Mini DBA in Your Browser
Open a populated Mini DBA Console immediately. No download, installation or account is required.
Try the Online Demo
What can I explore in the demo?