Legacy Documentation
Desktop And Mini DBA Server
Legacy Documentation Home
alerts
analysisservicesalerts
analysisservicescpu
analysisservicesdashboard
analysisservicesdatabases
analysisservicesio
analysisservicessessions
azurealerts
azuredatabase
azuredatabasehealthcheck
azureindexes
azurelocks
azure security
azuresessions
azuresql
azuresqldatabase
azuresqldatabasedashboard
azuresqldatabases
azure sql server dashboard
azuretables
azurewaits
compare performance baseline
connections
cpu
custom sql server alerts
database
database query performance
databases
defaulttrace
dm exec query statistics xml
documentation
errorlog
files
gettingstarted
healthcheck database
healthcheck sql server
history active
history blocking
history data storage
history deadlocks
history files
history memory
history viewer
history waits
howtoperformancetuneazuresqldatabase
how to performance tune sql server
how to sql server performance tuning
how to sql server query tuning
indexes
Installation
io
License Support
locks
maintenance windows
options
performance history
security
server
servergettingstarted
Server Installation
server memory
serveroptions
serversecurity
servertroubleshooting
sql database memory
sql execution plan
sql extended event sessions
sql server activity
sql server alert configuration
sql server alerts
sql server database
sql server execution plan view
sql server index defrag jobs
sqlserverindexfragmentation
sql server index fragmentation
sql server index maintenance
sql server live query statistics
sqlserverqueryperformance
sql server query performance
sql server send slack alerts
sql server send teams alerts
sql server transaction log
sql server wait statistics
tables
tranlog
waits
webmonitorconfigure
webmonitorconnections
webmonitorcurrent
webmonitorcustom
webmonitorenterprise
webmonitorgettingstarted
webmonitorhistoric
webmonitorinstallation
webmonitorio
webmonitormemory
webmonitoroptions
webmonitoroverview
webmonitorsecurity
webmonitorwaits
wmi
The execution plan viewer is available in several places in Mini DBA Desktop:
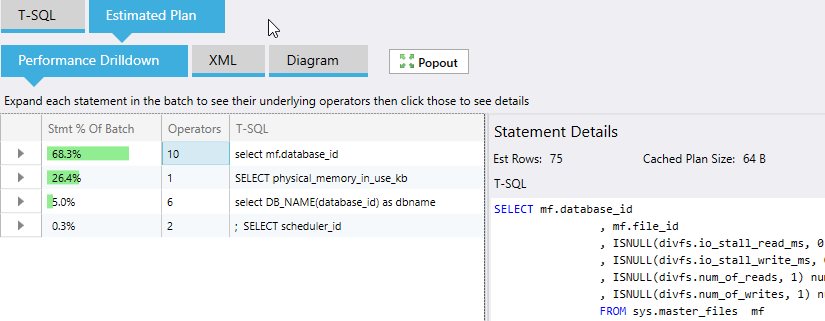
Details of the batch appear on the right including T-SQL statement, estimated rows and the cached plan size.
Expanding a statement on the left will display it's execution plan operators. They are ordered by operator cost (green bar), so the operator that accounts for most cost in the plan is at the top. This is equivalent to SQL Management Studios "Thickness of line" in a plan graphical view.
Execution plan operator reference list on MSDN
When clicking on an operator it's details will be displayed on the right hand side of the screen:
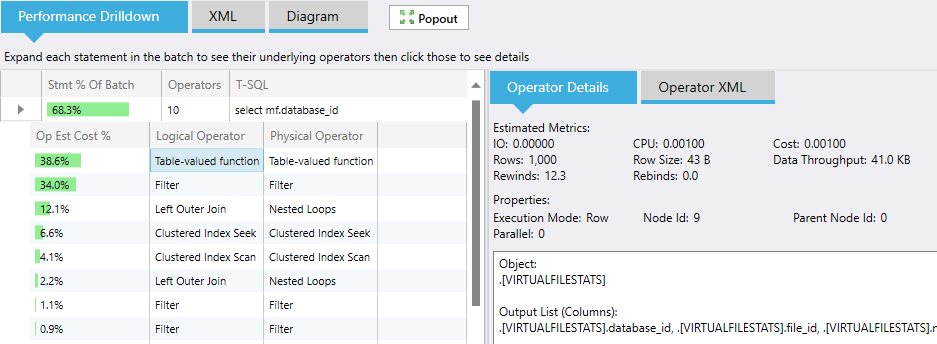
The details include the object like indexes and columns that are used by the operator plus metrics such as rows and execution mode. If the operator has a particularly high cost it could be worth looking up the operator in the operator list and assessing if it can be made more efficient particularly if it uses an index that is either fragmented or does not include all necessary columns (adding included columns is sometimes beneficial or creating a new index for this task).
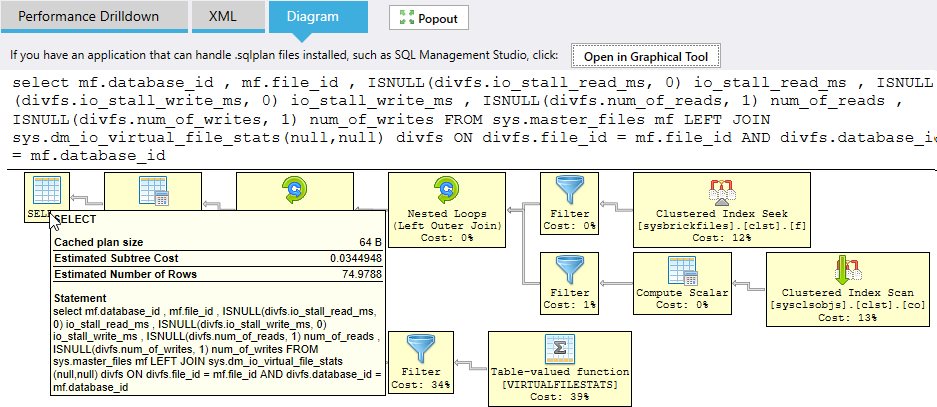
Click the "Open in Graphical Tool" button to open the plan as a .sqlplan file in Windows. If SQL Management studio or other application is installed and registered to handle .sqlplan files that app will show the plan.
This functionality is available in the free single sql connection version of Mini DBA Desktop and above.
- Activity
- Top SQL
- Historic Active SQL Statements
Performance Drilldown
The viewer defaults to showing the "Performance Drilldown" tab which shows each batch on the left order by the % of the batch the statement accounts for (green bar):
Details of the batch appear on the right including T-SQL statement, estimated rows and the cached plan size.
Expanding a statement on the left will display it's execution plan operators. They are ordered by operator cost (green bar), so the operator that accounts for most cost in the plan is at the top. This is equivalent to SQL Management Studios "Thickness of line" in a plan graphical view.
Execution plan operator reference list on MSDN
When clicking on an operator it's details will be displayed on the right hand side of the screen:
The details include the object like indexes and columns that are used by the operator plus metrics such as rows and execution mode. If the operator has a particularly high cost it could be worth looking up the operator in the operator list and assessing if it can be made more efficient particularly if it uses an index that is either fragmented or does not include all necessary columns (adding included columns is sometimes beneficial or creating a new index for this task).
XML
The execution plan XML is shown in the next tab along "XML". The xml is collapsible for easy navigation.Diagram
The graphical plan is then shown in the "Diagram" tab. Similar to SQL Management studio, suggested indexes are presented in green and hovering your cursor over individual operators displays their details in popup boxes:
Click the "Open in Graphical Tool" button to open the plan as a .sqlplan file in Windows. If SQL Management studio or other application is installed and registered to handle .sqlplan files that app will show the plan.
This functionality is available in the free single sql connection version of Mini DBA Desktop and above.