Legacy Documentation
Desktop And Mini DBA Server
Legacy Documentation Home
alerts
analysisservicesalerts
analysisservicescpu
analysisservicesdashboard
analysisservicesdatabases
analysisservicesio
analysisservicessessions
azurealerts
azuredatabase
azuredatabasehealthcheck
azureindexes
azurelocks
azure security
azuresessions
azuresql
azuresqldatabase
azuresqldatabasedashboard
azuresqldatabases
azure sql server dashboard
azuretables
azurewaits
compare performance baseline
connections
cpu
custom sql server alerts
database
database query performance
databases
defaulttrace
dm exec query statistics xml
documentation
errorlog
files
gettingstarted
healthcheck database
healthcheck sql server
history active
history blocking
history data storage
history deadlocks
history files
history memory
history viewer
history waits
howtoperformancetuneazuresqldatabase
how to performance tune sql server
how to sql server performance tuning
how to sql server query tuning
indexes
Installation
io
License Support
locks
maintenance windows
options
performance history
security
server
servergettingstarted
Server Installation
server memory
serveroptions
serversecurity
servertroubleshooting
sql database memory
sql execution plan
sql extended event sessions
sql server activity
sql server alert configuration
sql server alerts
sql server database
sql server execution plan view
sql server index defrag jobs
sqlserverindexfragmentation
sql server index fragmentation
sql server index maintenance
sql server live query statistics
sqlserverqueryperformance
sql server query performance
sql server send slack alerts
sql server send teams alerts
sql server transaction log
sql server wait statistics
tables
tranlog
waits
webmonitorconfigure
webmonitorconnections
webmonitorcurrent
webmonitorcustom
webmonitorenterprise
webmonitorgettingstarted
webmonitorhistoric
webmonitorinstallation
webmonitorio
webmonitormemory
webmonitoroptions
webmonitoroverview
webmonitorsecurity
webmonitorwaits
wmi
The historic performance data dashboard lets you load 2 datasets - the current and also a second comparison
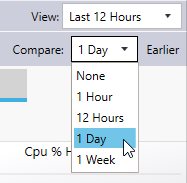
Load the comparison data after loading your initial historic data by clicking the "Compare" dropdown and select how long prior to the current loaded data you want to see. If you have loaded 1 hour of data the comparison will be 1 hour long. For example if you have 1 hour of data loaded for Friday and load a comparison 1 day prior - the same hour on thursday will be loaded.
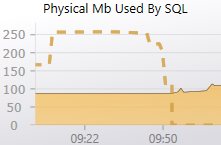
Then performance charts will show a dotted line for the comparison baseline data and the currently loaded data will continue to be shown as before.
Alternatively you can load whole days of comparin baseline data from the instance/date control on the left of the screen and select either "Load History" or "Load as Comparison" buttons:
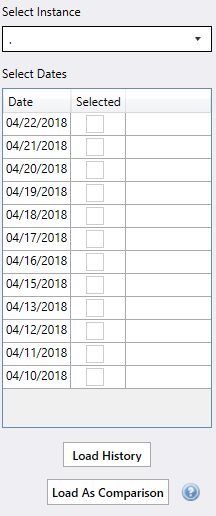
The first button loads the data normally the second loads as the dotted comparison data lines.
Unexpected anomolies and trends should stand out visually and allow you to home in on problem areas. Increased comsumption of memory and changing transactional throughput over time are particularly easy to identify using the comparison baselines.
It is always good to occassionally compare a current day of performance to a day from a few weeks prior to see if there are any negative performance traends that could become a problem. This preventative trend analysis can be performed using t-sql scripts and spreadsheets plus lots of your time without Mini DBA but using the comparison baseline makes it a low difficulty task.
Load the comparison data after loading your initial historic data by clicking the "Compare" dropdown and select how long prior to the current loaded data you want to see. If you have loaded 1 hour of data the comparison will be 1 hour long. For example if you have 1 hour of data loaded for Friday and load a comparison 1 day prior - the same hour on thursday will be loaded.
Then performance charts will show a dotted line for the comparison baseline data and the currently loaded data will continue to be shown as before.
Alternatively you can load whole days of comparin baseline data from the instance/date control on the left of the screen and select either "Load History" or "Load as Comparison" buttons:
The first button loads the data normally the second loads as the dotted comparison data lines.
Compare SQL Performance Baselines
When the 2 datasets are loaded you will be able to start comparing the orignal set (the baseline) with the new comparison data.Unexpected anomolies and trends should stand out visually and allow you to home in on problem areas. Increased comsumption of memory and changing transactional throughput over time are particularly easy to identify using the comparison baselines.
It is always good to occassionally compare a current day of performance to a day from a few weeks prior to see if there are any negative performance traends that could become a problem. This preventative trend analysis can be performed using t-sql scripts and spreadsheets plus lots of your time without Mini DBA but using the comparison baseline makes it a low difficulty task.