Legacy Documentation
Desktop And Mini DBA Server
Legacy Documentation Home
alerts
analysisservicesalerts
analysisservicescpu
analysisservicesdashboard
analysisservicesdatabases
analysisservicesio
analysisservicessessions
azurealerts
azuredatabase
azuredatabasehealthcheck
azureindexes
azurelocks
azure security
azuresessions
azuresql
azuresqldatabase
azuresqldatabasedashboard
azuresqldatabases
azure sql server dashboard
azuretables
azurewaits
compare performance baseline
connections
cpu
custom sql server alerts
database
database query performance
databases
defaulttrace
dm exec query statistics xml
documentation
errorlog
files
gettingstarted
healthcheck database
healthcheck sql server
history active
history blocking
history data storage
history deadlocks
history files
history memory
history viewer
history waits
howtoperformancetuneazuresqldatabase
how to performance tune sql server
how to sql server performance tuning
how to sql server query tuning
indexes
Installation
io
License Support
locks
maintenance windows
options
performance history
security
server
servergettingstarted
Server Installation
server memory
serveroptions
serversecurity
servertroubleshooting
sql database memory
sql execution plan
sql extended event sessions
sql server activity
sql server alert configuration
sql server alerts
sql server database
sql server execution plan view
sql server index defrag jobs
sqlserverindexfragmentation
sql server index fragmentation
sql server index maintenance
sql server live query statistics
sqlserverqueryperformance
sql server query performance
sql server send slack alerts
sql server send teams alerts
sql server transaction log
sql server wait statistics
tables
tranlog
waits
webmonitorconfigure
webmonitorconnections
webmonitorcurrent
webmonitorcustom
webmonitorenterprise
webmonitorgettingstarted
webmonitorhistoric
webmonitorinstallation
webmonitorio
webmonitormemory
webmonitoroptions
webmonitoroverview
webmonitorsecurity
webmonitorwaits
wmi
The Database Dashboard displays metrics and properties specific to an individual database.
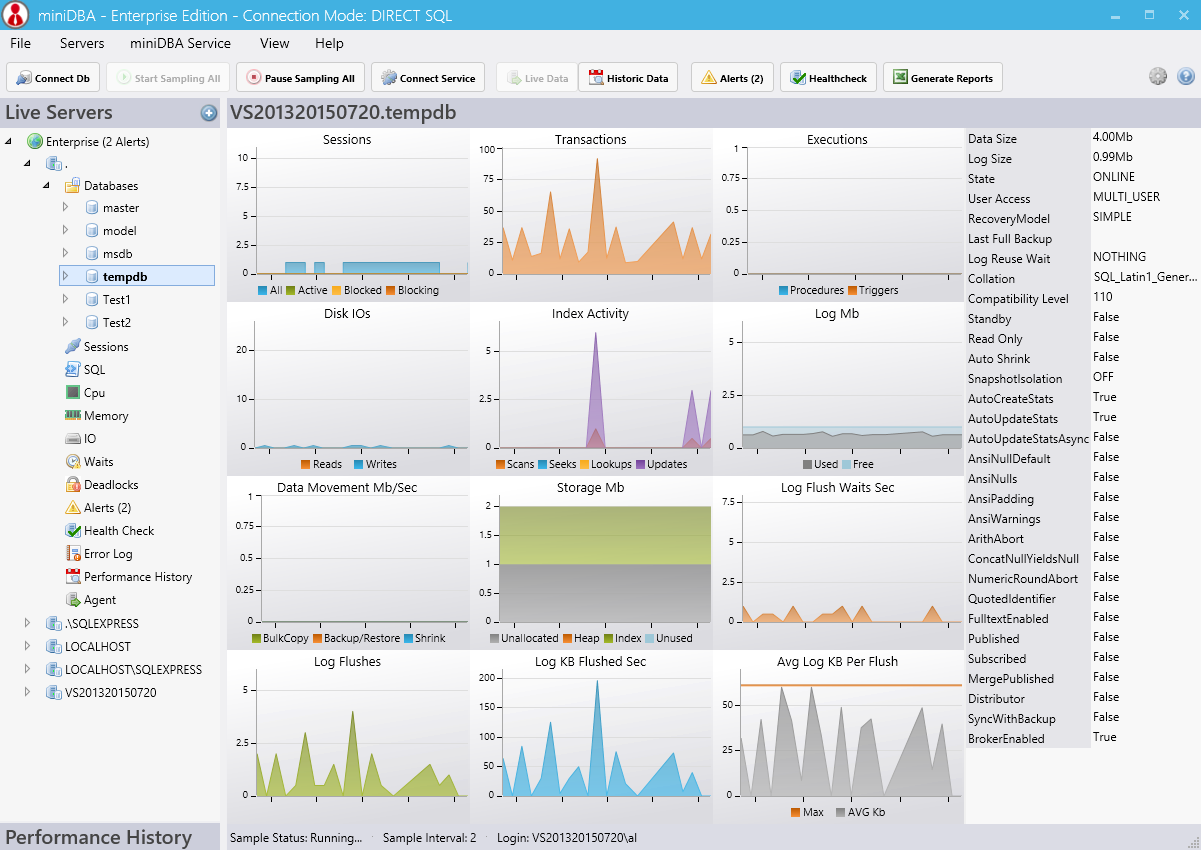
Activity counters such as transactions & log flushes are the 'Per Second' values, therefore you may see values of less than 1 depending on you sample interval.
Charts
- Sessions: Active, blocking and blocked requests and sessions.
- Transactions Sec: The mainstay metric for monitoring sql database throughput capacity.
- Executions: See how many stored procedure and trigger executions are occurring.
- Disk IOs: Reads and writes by the database to disk. Understand the IO usage of each database here.
- Index Activity: Scans, seeks, lookups and update operations are displayed here. Aim to reduce scans and maximize seeks through intelligent indexing.
- Log Mb: Track how large and how full your transaction log gets. Out of control log growth may occur if long running transactions block log truncation.
- Data Movement: Bulk Copy, backup, restore and shrink operations data throughput is tracked here. Any of these could slow down the database, often backups run during peak times will reduce transactional performance. This chart gives you a quick insight into how much data bandwidth is being used by these operations.
- Disk Storage: Unallocated, heap, index and unused data file pages are shown. Look out for large amounts of heap use as it may mean tables you thought were indexed are in fact not.
- Log Flush Waits: Log flushes should be as fast as possible. If they cannot execute straight away it means they are waiting for something else to operate on the disk. Identify disk IO contention here by looking for high numbers of waits.
- Log Flushes Sec: Another way to view log flush data bandwidth and also the characteristics of how many flushes each database needs to perform.
- Log Kb Flushed Sec: Log data bandwidth.
- Average Log Kb Per Flush: Log flushes are limited to 64kb so there is an orange line to show the limit. Write T-SQL to try to flush as much data up to that limit per flush. Low data size flushes are not efficient.
Activity counters such as transactions & log flushes are the 'Per Second' values, therefore you may see values of less than 1 depending on you sample interval.
Database Properties
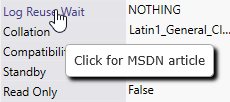
On the right can be seen the database properties. Mouse over any property labels to be given a link to the associated MSDN article for the property. The properties will automatically update every 10 minutes and do not require an explicit refresh by you.