Legacy Documentation
Desktop And Mini DBA Server
Legacy Documentation Home
alerts
analysisservicesalerts
analysisservicescpu
analysisservicesdashboard
analysisservicesdatabases
analysisservicesio
analysisservicessessions
azurealerts
azuredatabase
azuredatabasehealthcheck
azureindexes
azurelocks
azure security
azuresessions
azuresql
azuresqldatabase
azuresqldatabasedashboard
azuresqldatabases
azure sql server dashboard
azuretables
azurewaits
compare performance baseline
connections
cpu
custom sql server alerts
database
database query performance
databases
defaulttrace
dm exec query statistics xml
documentation
errorlog
files
gettingstarted
healthcheck database
healthcheck sql server
history active
history blocking
history data storage
history deadlocks
history files
history memory
history viewer
history waits
howtoperformancetuneazuresqldatabase
how to performance tune sql server
how to sql server performance tuning
how to sql server query tuning
indexes
Installation
io
License Support
locks
maintenance windows
options
performance history
security
server
servergettingstarted
Server Installation
server memory
serveroptions
serversecurity
servertroubleshooting
sql database memory
sql execution plan
sql extended event sessions
sql server activity
sql server alert configuration
sql server alerts
sql server database
sql server execution plan view
sql server index defrag jobs
sqlserverindexfragmentation
sql server index fragmentation
sql server index maintenance
sql server live query statistics
sqlserverqueryperformance
sql server query performance
sql server send slack alerts
sql server send teams alerts
sql server transaction log
sql server wait statistics
tables
tranlog
waits
webmonitorconfigure
webmonitorconnections
webmonitorcurrent
webmonitorcustom
webmonitorenterprise
webmonitorgettingstarted
webmonitorhistoric
webmonitorinstallation
webmonitorio
webmonitormemory
webmonitoroptions
webmonitoroverview
webmonitorsecurity
webmonitorwaits
wmi
SQL Server reads data from disk into it's buffer cache when required (it does not load it all whe the server starts). It keeps it in memory until it deems it not required any more and the memory is needed for other data. This means at any time your databases will have some but probably not all their data in memory (the buffer cache). Mini DBA helps you see exactly what data and how much data is in the cache per database by giving you the Database Memory dashboard.
Once loaded the memory dashboard displays memory summary data at the top of the screen.
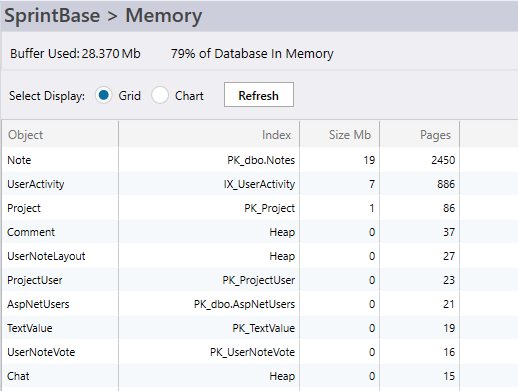
Initially memory use is displayed as a grid view detailed information is displayed on memory usage for the current database.
Also importantly by their lack of presence, which indexes are not used. If you were expecting to see your shiny new index take some memory here but you can't see it, it is not being used by queries so some index tuning is still required.
Similarly this view allows you to see indexes that you thought had been disabled or dropped as they will be displayed here consuming memory.
Clicking the chart radio button will display the memory data as a treemap chart. The size of each block equates to the amount of memory used by the object.
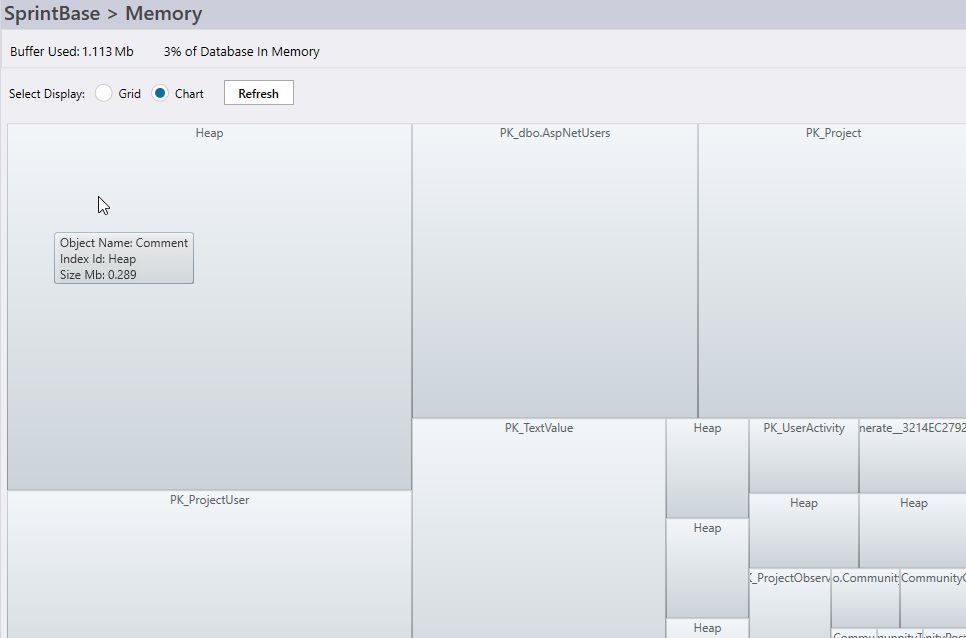
The screenshot above gives an interesting example of a very large object visually standing out "HEAP". This is a warning flag as it means the object with the most amount of data in the database does not have a clustered index, making reading slow in most situations.
The query to read database memory use may take a long time to execute depending on the size of the database. Because of this reason this page does not automatically update and instead has a "Refresh" button. Click it to re-query the server for the latest memory data.
This functionality is available in the free single sql connection version of Mini DBA Desktop and above.
Once loaded the memory dashboard displays memory summary data at the top of the screen.
- Buffer Used: Total Mb of the database's data in the SQL Server buffer
- % Database in Memory: % of the overall size of the database that has been read into the buffer. The higher this number the better as no slow disk access will be required. Most databases should be aiming for near 100% after a period of activity as memory is cheap.
Initially memory use is displayed as a grid view detailed information is displayed on memory usage for the current database.
- Object: The table or indexed view the holds the data.
- Index: The index that has it's pages in memory.
- Size Mb: Size in Mb of the part of the index in the buffer.
- Pages: Number of pages of the index in the buffer.
Also importantly by their lack of presence, which indexes are not used. If you were expecting to see your shiny new index take some memory here but you can't see it, it is not being used by queries so some index tuning is still required.
Similarly this view allows you to see indexes that you thought had been disabled or dropped as they will be displayed here consuming memory.
Clicking the chart radio button will display the memory data as a treemap chart. The size of each block equates to the amount of memory used by the object.
The screenshot above gives an interesting example of a very large object visually standing out "HEAP". This is a warning flag as it means the object with the most amount of data in the database does not have a clustered index, making reading slow in most situations.
The query to read database memory use may take a long time to execute depending on the size of the database. Because of this reason this page does not automatically update and instead has a "Refresh" button. Click it to re-query the server for the latest memory data.
This functionality is available in the free single sql connection version of Mini DBA Desktop and above.