SQL Server monitoring that gets you from alert to cause
When SQL Server slows down, the urgent question is not whether CPU is high—it is which workload, wait, lock or plan caused the change. Mini DBA keeps the live and historical evidence together so DBAs can investigate without assembling a trail from separate tools.
Monitor SQL Server on Windows or Linux, on premises, in a VM or in a supported cloud environment. Start with estate health, then drill into a server, database, session, query or execution plan while the context is still available.
Problems you can solve faster
- Identify blocking chains, long-running sessions and deadlocks.
- Separate CPU, memory, storage and wait-related bottlenecks.
- Find expensive SQL and inspect execution-plan warnings.
- Catch file growth, job, availability and configuration risks early.
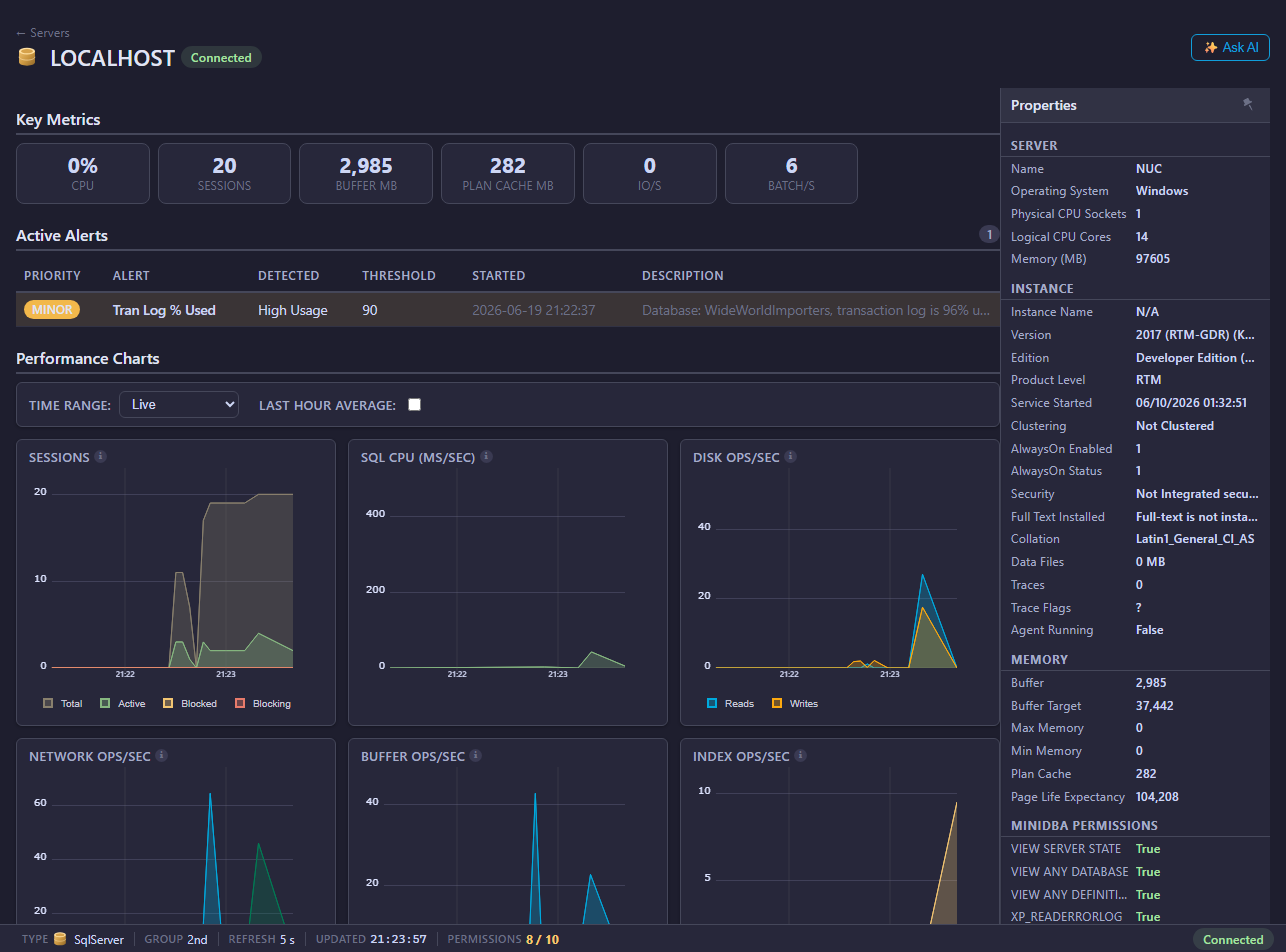
SQL Server overviewSee alerts, workload and resource pressure together.
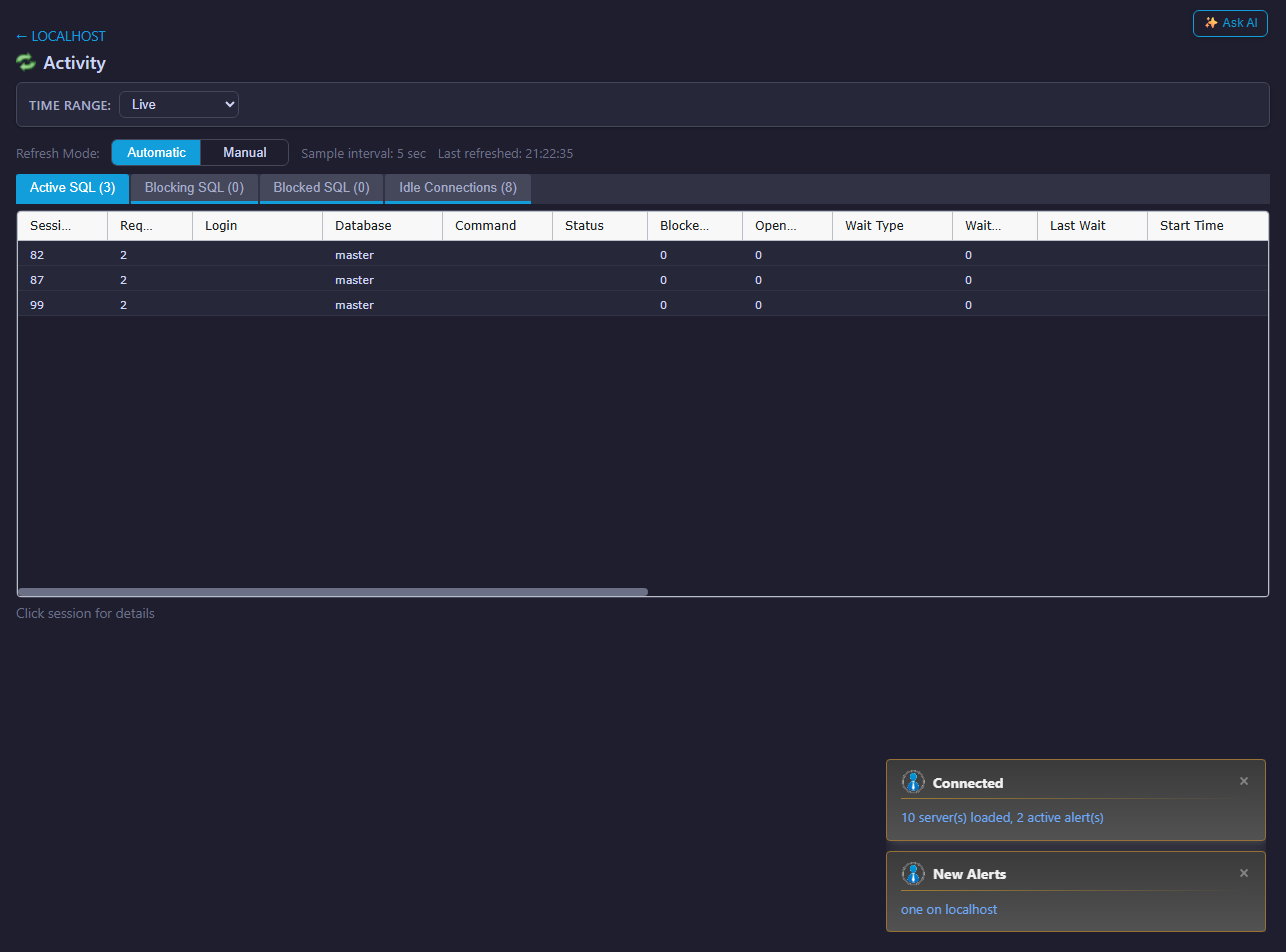
Live activityInvestigate active, blocked and blocking sessions.
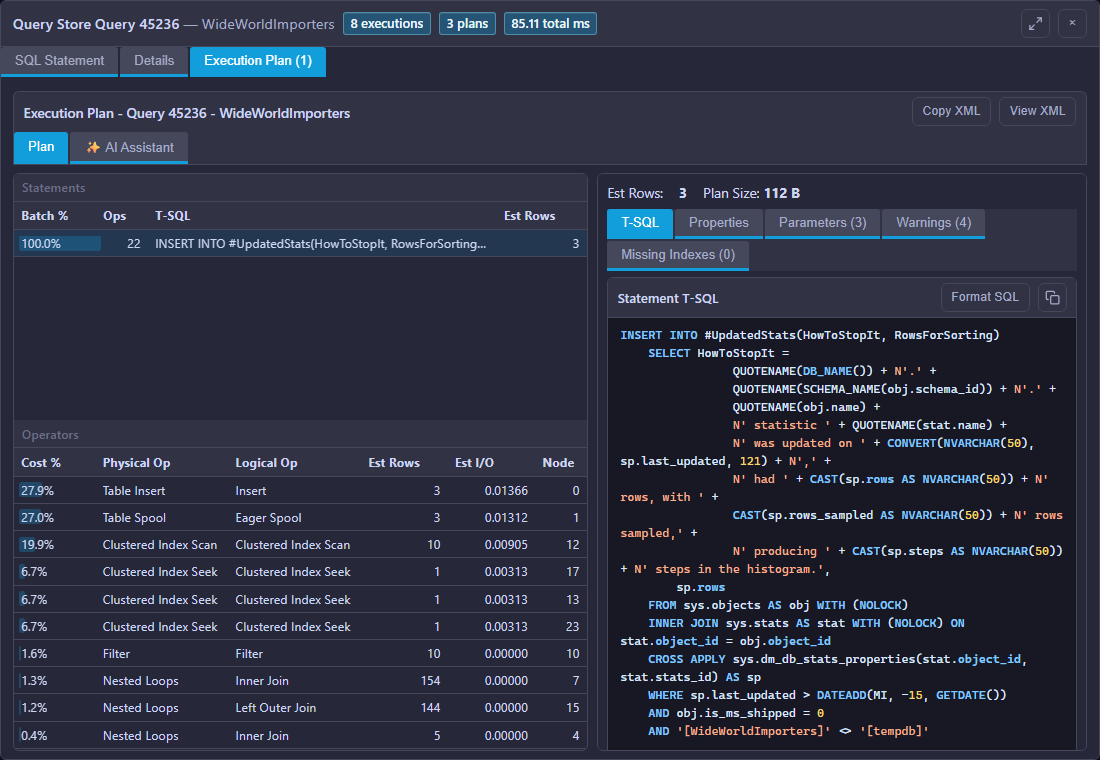
Execution plansTrace expensive statements down to operators and warnings.
SQL Server monitoring features
- Live sessions, blocking, deadlocks, waits and server activity.
- Query analysis, cached SQL, Query Store and execution plans.
- CPU, memory, drives, database files and I/O diagnostics.
- Indexes, Agent jobs, Always On, error logs and health checks.
- Database-level detail for configuration, growth and workload changes.
Keep the evidence, not just the alert
- Metric and query history for comparing the incident with normal behaviour.
- Configurable alerts and alert history with email and integration options.
- AI Assistant for guided investigation using current monitoring context.
- MCP Server access for approved AI clients and operational workflows.
- One browser Console across SQL Server and the rest of your database estate.
Monitor every database platform from one Console
See what is slowing your databases down
Install Mini DBA on Windows, a suitable Linux VM or a supported container platform, connect an Engine and start collecting the evidence behind performance incidents.
Download Mini DBA