MySQL and MariaDB monitoring without blind spots
A rising connection count, buffer-pool pressure or one inefficient statement can turn a responsive MySQL or MariaDB application into a queue. Mini DBA connects server resources, InnoDB behaviour and query activity so the investigation follows evidence rather than guesses.
Monitor operational health continuously, retain query and metric history, and move from an estate-level warning into the sessions, statements, locks or database behaviour responsible for it.
Problems you can solve faster
- Find connection saturation and excessive running threads.
- Diagnose InnoDB buffer-pool, log and lock pressure.
- Expose slow, scanning or error-prone statements.
- Catch deadlocks, disk temporary tables and replication risks.
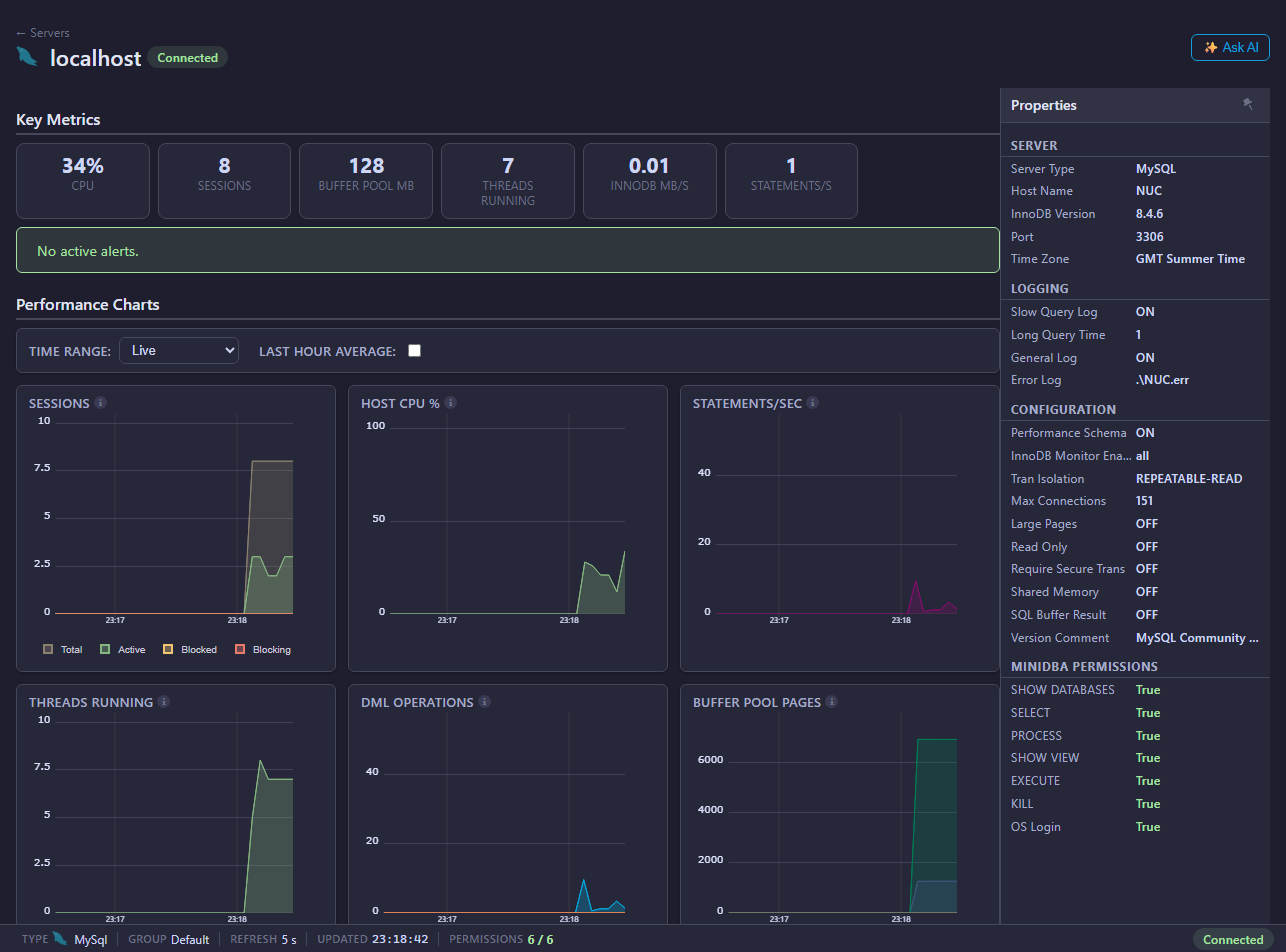
MySQL and MariaDB overviewSee sessions, throughput, memory and alerts together.

Live activityFind the connections and statements consuming capacity.

InnoDB diagnosticsUnderstand buffer-pool, log, row and lock behaviour.
MySQL and MariaDB monitoring features
- Sessions, statements, blocking, deadlocks and execution plans.
- InnoDB buffer pool, locks, logs and row-operation diagnostics.
- CPU, memory, database activity, I/O and connection capacity.
- Health checks for configuration, security and workload risks.
- Permissions and database-level investigation views.
Shared operational intelligence
- Metric and query history for incident review and trend comparison.
- Configurable alerts and alert history with notification options.
- AI Assistant for guided diagnosis using current monitoring context.
- MCP Server access for approved AI clients and workflows.
- One browser Console across mixed database estates.
Monitor every database platform from one Console
See what is slowing your databases down
Install Mini DBA on Windows, a suitable Linux VM or a supported container platform, connect an Engine and start collecting the evidence behind performance incidents.
Download Mini DBA