PostgreSQL monitoring for the problems users actually feel
Slow PostgreSQL applications often begin with a small operational change: a long transaction prevents cleanup, a query starts scanning, connections accumulate or storage latency rises. Mini DBA brings sessions, queries, waits, vacuum health and host pressure into one investigation path.
Use the browser Console to monitor production PostgreSQL continuously, retain the performance trail behind an incident and compare current behaviour with recent history instead of relying on a snapshot taken after the problem has gone.
Problems you can solve faster
- Find long transactions, blocking sessions and lock contention.
- Spot vacuum debt, dead tuples and wraparound risk.
- Investigate slow queries, I/O pressure and cache effectiveness.
- Track WAL, connection capacity and unsafe setting changes.
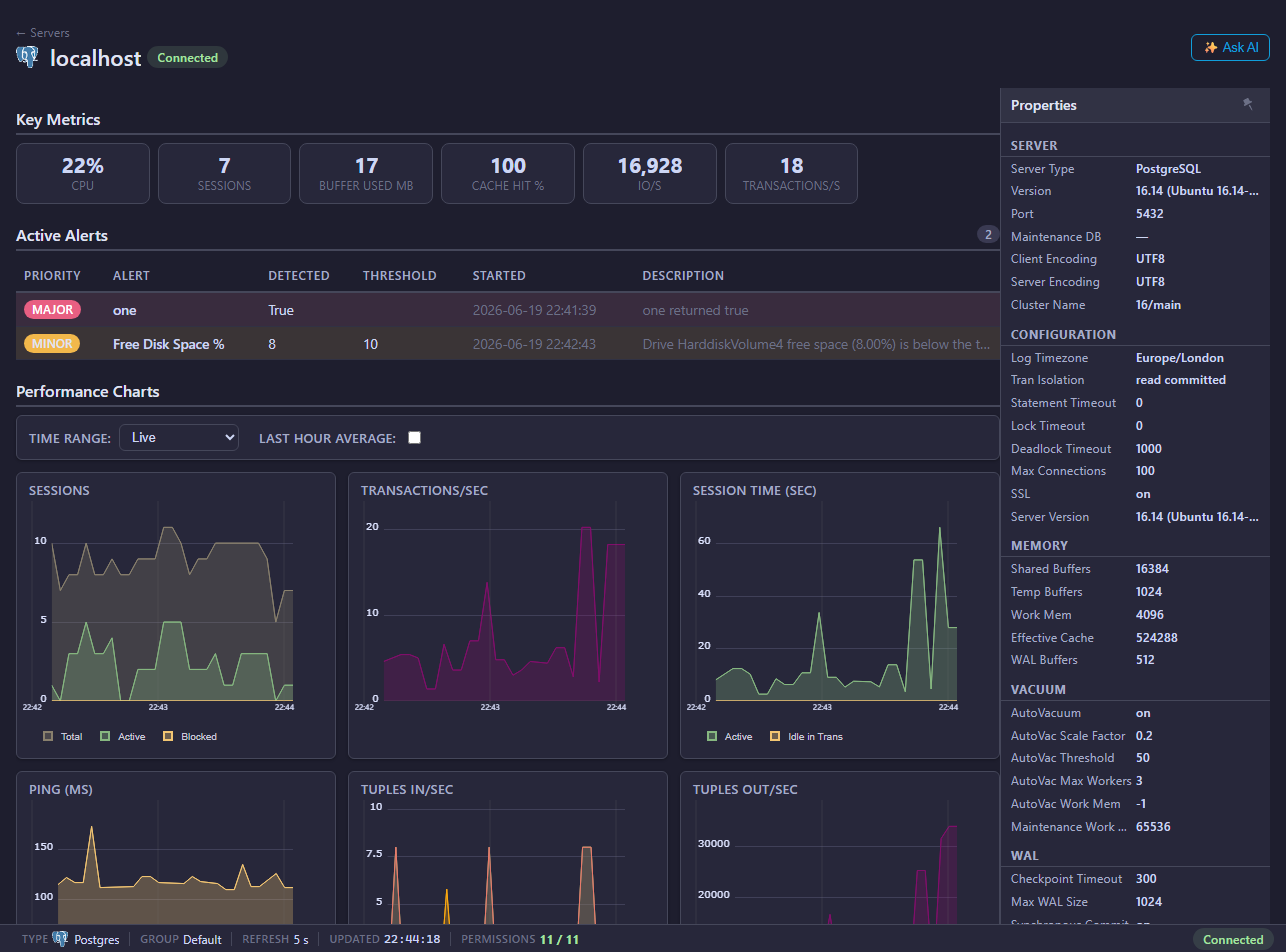
PostgreSQL overviewBring workload, resources and configuration into one view.

Live activitySee the sessions and statements driving current load.

Health checksTurn configuration and maintenance risks into clear actions.
PostgreSQL monitoring features
- Sessions, queries, locks, deadlocks and wait analysis.
- Database activity, indexes, memory, I/O and host resource views.
- Vacuum, dead tuple, WAL and configuration health checks.
- Execution-plan inspection and query performance tuning evidence.
- Log, permission and database-level diagnostic views.
Shared operational intelligence
- Metric and query history that preserves what happened before an incident.
- Configurable alerts and alert history for performance and availability risks.
- AI Assistant for guided analysis using PostgreSQL monitoring context.
- MCP Server access for approved AI clients and automation.
- Multi-site monitoring through optional additional Engines for advanced estates.
Monitor every database platform from one Console
See what is slowing your databases down
Install Mini DBA on Windows, a suitable Linux VM or a supported container platform, connect an Engine and start collecting the evidence behind performance incidents.
Download Mini DBA