Azure SQL monitoring beyond the portal headline
A high DTU or vCore percentage tells you that Azure SQL is under pressure, but not which query, wait, session or database behaviour created it. Mini DBA connects service-level resource signals with database workload so you can tune the cause before paying for more capacity.
Monitor individual databases and logical servers from the same Console as the rest of your estate, retaining the query and metric evidence needed to explain intermittent performance and capacity events.
Problems you can solve faster
- Find queries behind DTU, vCore, data I/O or log pressure.
- Investigate blocking, deadlocks, waits and connection limits.
- See contention and capacity across elastic pools.
- Catch storage, service-tier and database health risks early.
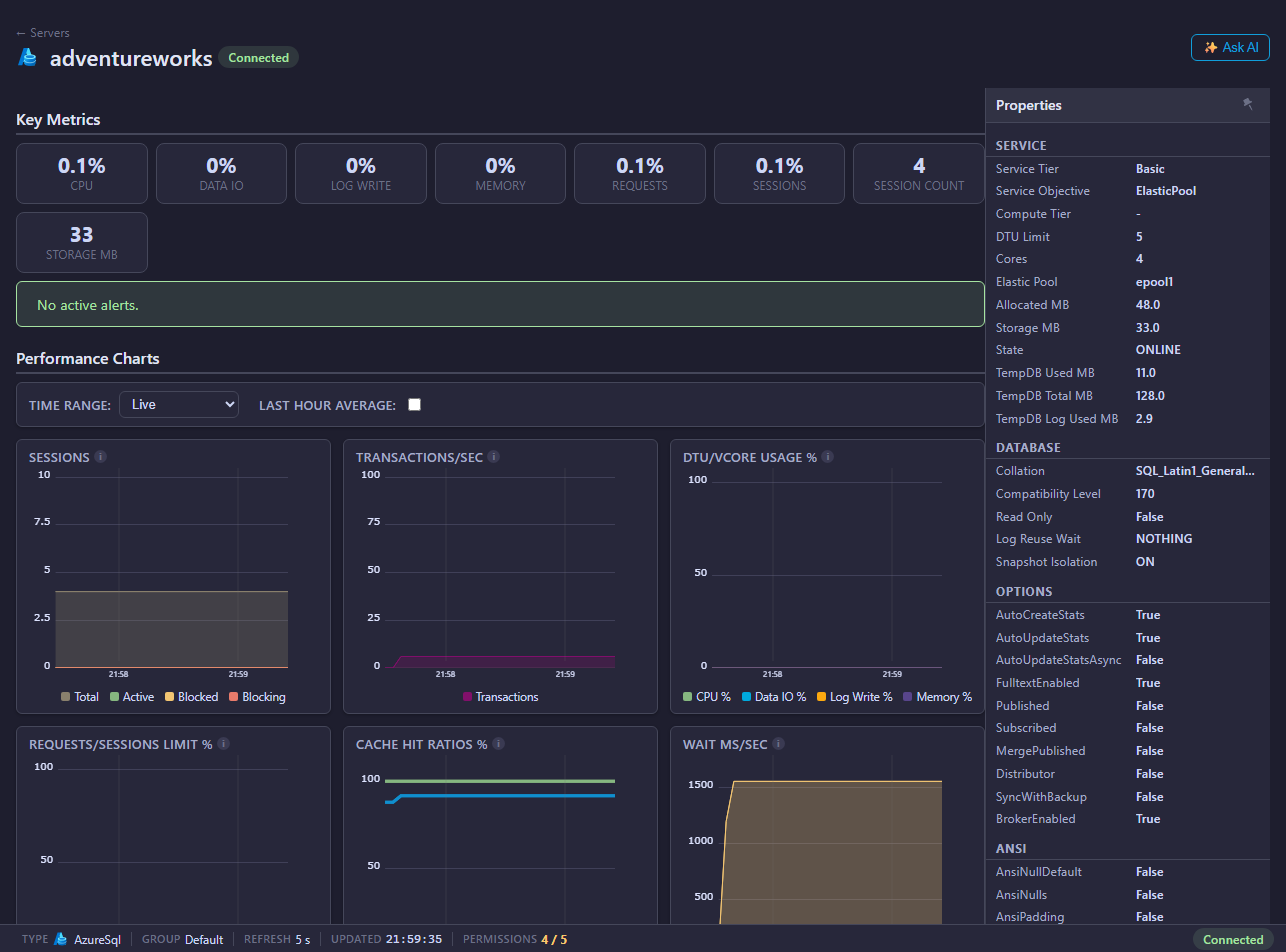
Azure SQL overviewConnect service utilisation with database workload.

Database dashboardDrill into workload, waits, queries and database health.

Elastic poolsSee which databases are consuming shared capacity.
Azure SQL monitoring features
- DTU or vCore, CPU, data I/O, log and storage monitoring.
- Sessions, queries, waits, blocking, deadlocks and Query Store.
- Logical server, database and elastic-pool visibility.
- Indexes, files, memory, permissions and health checks.
- Profiler and performance-tuning evidence for difficult workloads.
Shared operational intelligence
- Metric and query history for transient cloud performance events.
- Configurable alerts and alert history for resource and availability risks.
- AI Assistant for guided diagnosis using Azure SQL context.
- MCP Server access for approved AI clients and workflows.
- One Console for Azure SQL and on-premises database platforms.
Monitor every database platform from one Console
See what is slowing your databases down
Install Mini DBA on Windows, a suitable Linux VM or a supported container platform, connect an Engine and start collecting the evidence behind performance incidents.
Download Mini DBA