Oracle monitoring that connects waits, workload and capacity
Oracle incidents rarely fit into one metric. A slow service may involve a wait-class shift, a blocking session, a costly SQL plan, memory pressure or a tablespace approaching its limit. Mini DBA keeps those signals in one browser workflow so teams can establish cause and impact quickly.
Use live diagnostics for the immediate investigation and retained history for the question that comes next: what changed, when did it start, and is this behaviour different from the normal workload?
Problems you can solve faster
- Identify blocking, long-running and inactive sessions.
- Find dominant waits and expensive SQL.
- Track SGA, PGA, physical I/O and connection pressure.
- Catch tablespace, archive, alert-log and Data Guard risks.
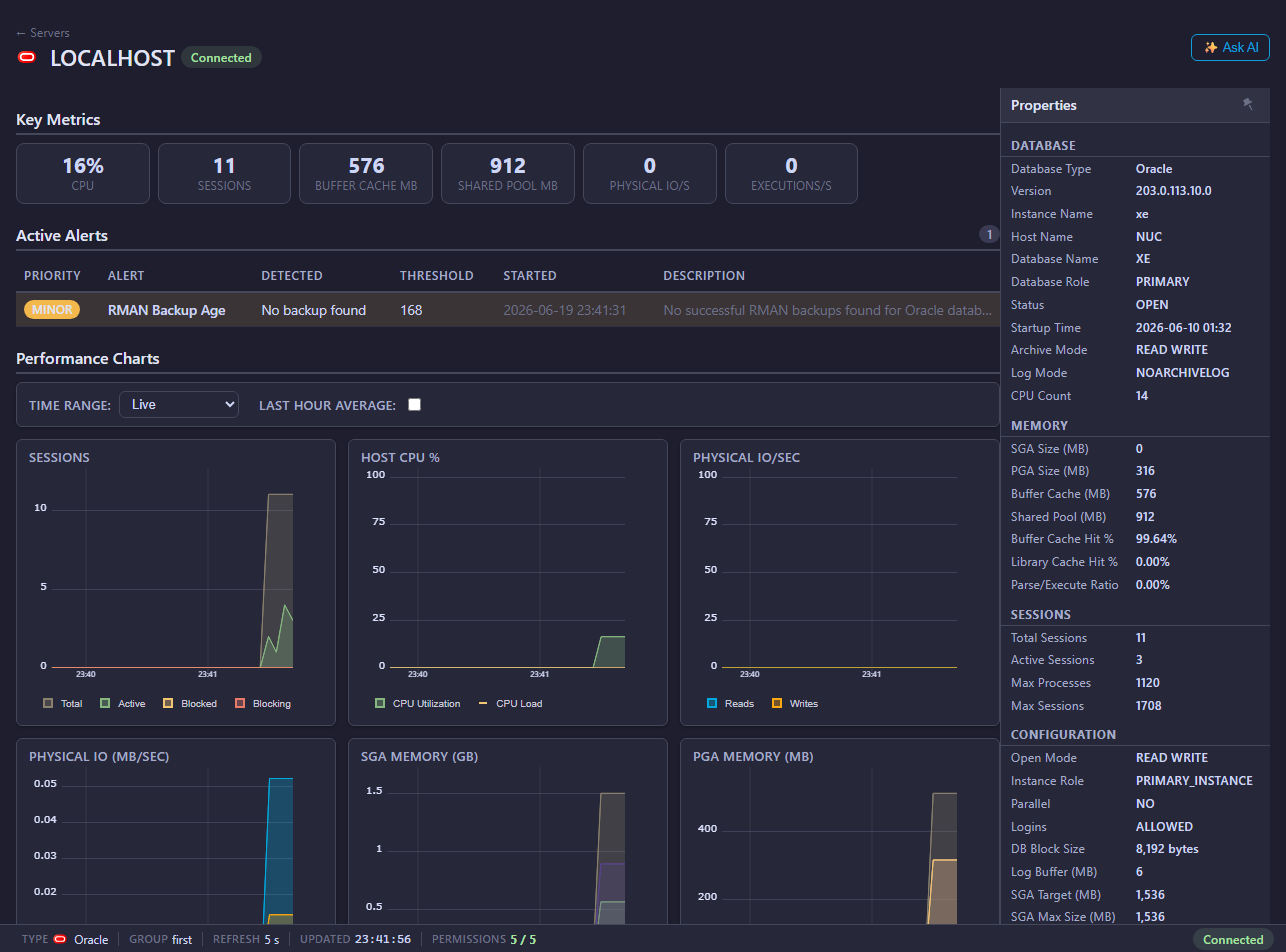
Oracle overviewReview workload, memory, I/O, limits and active alerts.

Wait analysisSee which wait classes and events consume database time.

Health checksSurface capacity, resilience, configuration and security risks.
Oracle monitoring features
- Sessions, waits, queries and execution-plan inspection.
- SGA, PGA, CPU, physical I/O and database activity.
- Database and pluggable-database operational views.
- Health checks for tablespaces, recovery, security and resilience.
- Performance-tuning evidence without changing the monitored workload.
Shared operational intelligence
- Metric and query history for incidents that have already passed.
- Configurable alerts and alert history for operational risks.
- AI Assistant for guided investigation using Oracle context.
- MCP Server access for approved AI clients and automation.
- Multi-site monitoring for advanced and distributed environments.
Monitor every database platform from one Console
See what is slowing your databases down
Install Mini DBA on Windows, a suitable Linux VM or a supported container platform, connect an Engine and start collecting the evidence behind performance incidents.
Download Mini DBA