Server Dashboard
Activity
Live Query Statistics
Profiler
Server Memory
Waits
Error Log
Cpu
IO
SQL Queries
Healthcheck
Databases
Database
Tables/Partitions
Index Use
Index Fragmentation
Files
Locks
Memory
SQL Queries
Default Trace
Transaction Log
Healthcheck
Execution Plan View
Index Maintenance
Manual Index Analysis
Index Defragmentation Jobs
Alerts
Configuration
Slack Integration
Teams Integration
Custom SQL Alerts
Maintenance Windows
SQL Server Alerts List
Table Schema
Initially miniDBA displays a list of all database tables and selects the first one, displaying below its schema in a table and also a diagram of the selected table and related tables. The number of rows, size of data and number of partitions are idsplayed in the grid.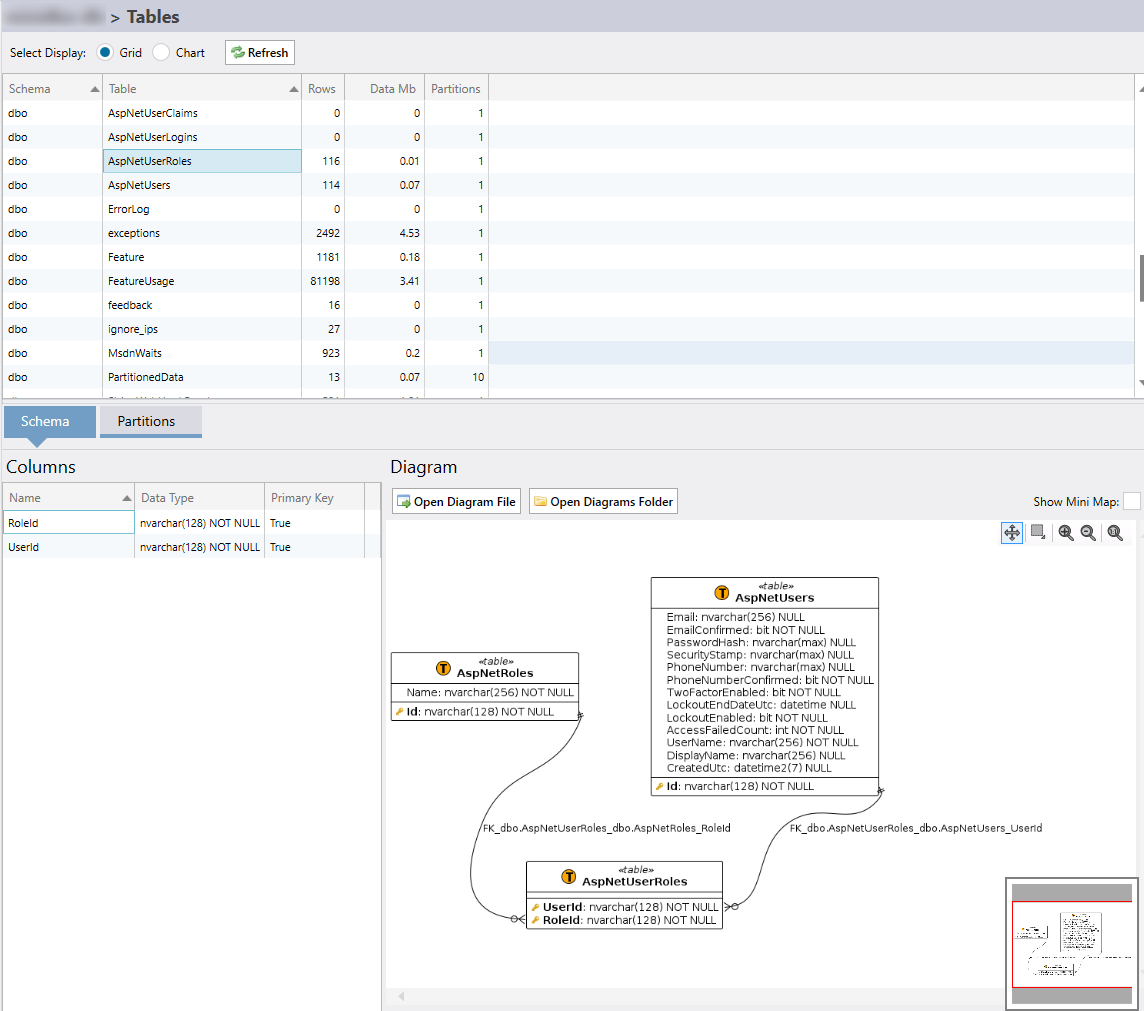
Schema Diagram
The automatically created schema diagram shows the selected table with any other tables related by foreign key. The diagram is interactive and can be zoomed and panned. Use the mini map in the bottom right corner to navigate large diagrams.The diagram can be exported to an image file by clicking the "Open Diagram File" button. The file will load in your default editor and can be annotated there if required.
The "Open Diagrams Folder" will open the folder where the diagram files are stored. The diagram files are auto named acording to their schema.
Partitions
The partitions tab displays table partition meta data for the selected table. Size, boundary values, filegroup and compression information is displayed for each partition.Using the rows and data page columns the distribution of data for a table can be seen over each partition.
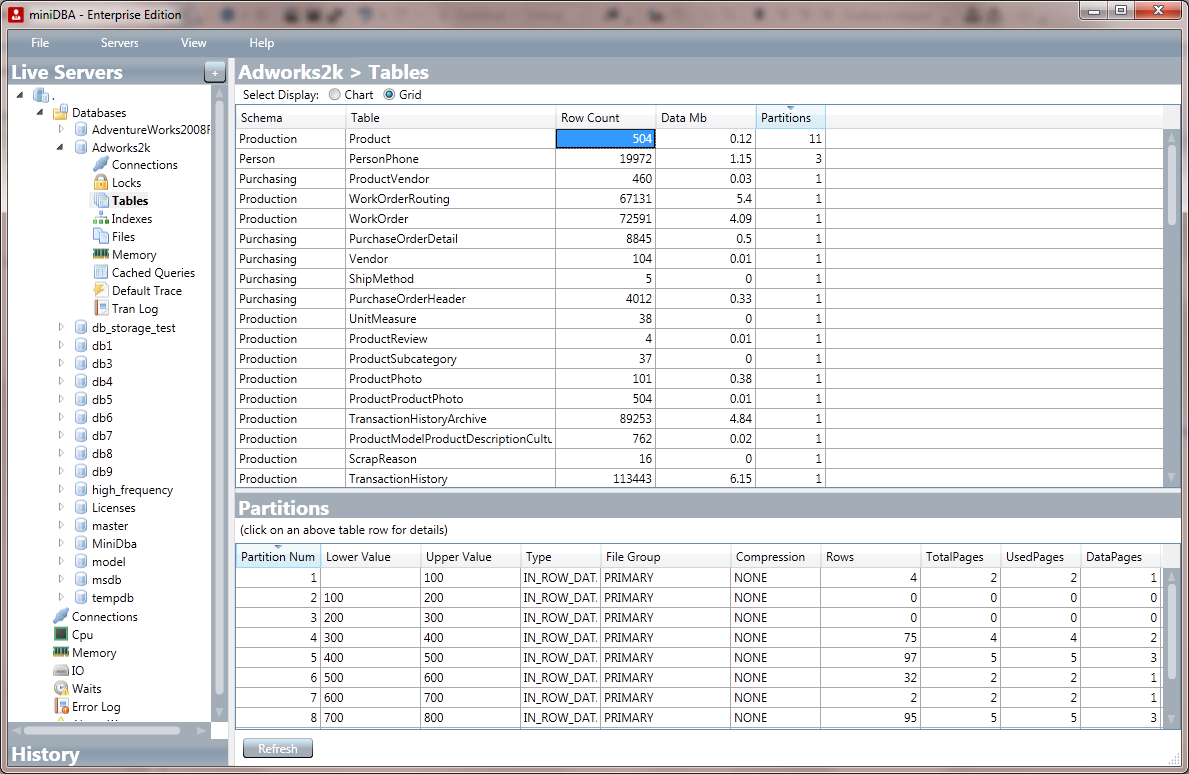
Table Sizes
Click the top "Chart" radio button to display a graph that displays each table based on its storage size with detailed information given in tooltips for each table. This makes it easy to get an appreciation for outstandingly large tables and where large disk space consumption is occuring.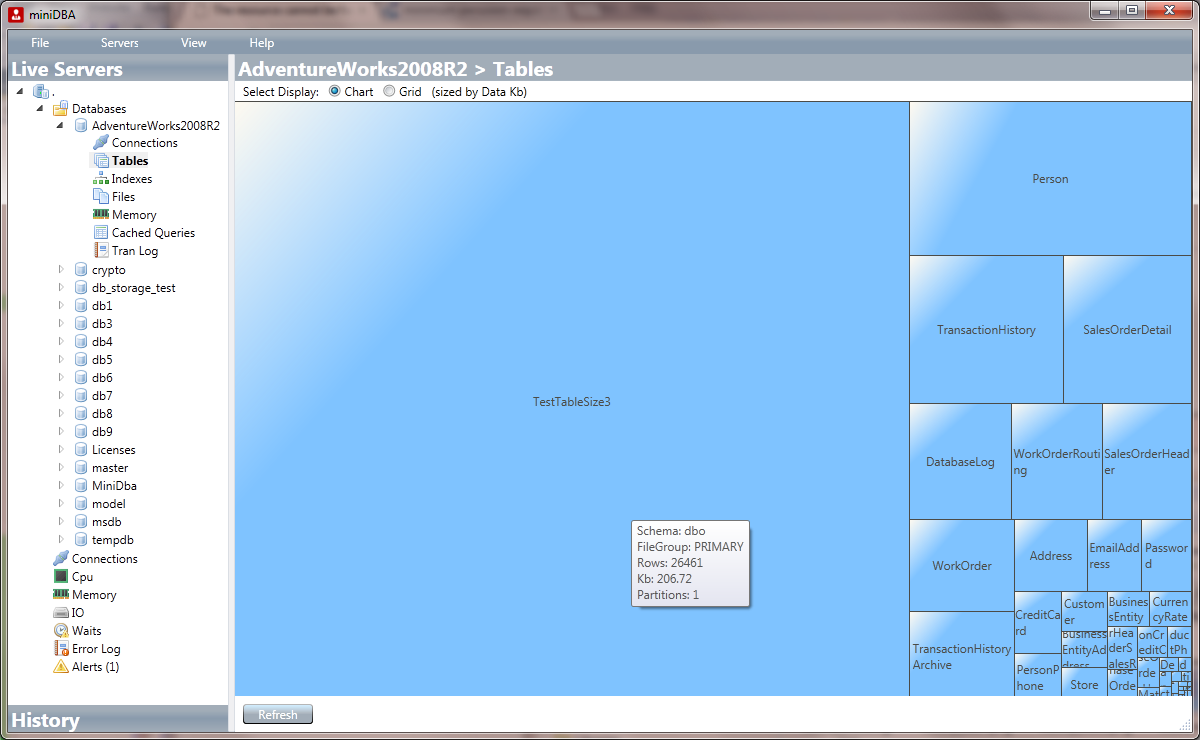
When the grid is selected more detailed table information is displayed which can be sorted by clicking column headers. Storage and also the number of partitions per table can be seen here.