Server Dashboard
Activity
Live Query Statistics
Profiler
Server Memory
Waits
Error Log
Cpu
IO
SQL Queries
Healthcheck
Databases
Database
Tables/Partitions
Index Use
Index Fragmentation
Files
Locks
Memory
SQL Queries
Default Trace
Transaction Log
Healthcheck
Execution Plan View
Index Maintenance
Manual Index Analysis
Index Defragmentation Jobs
Alerts
Configuration
Slack Integration
Teams Integration
Custom SQL Alerts
Maintenance Windows
SQL Server Alerts List
This guide, through several parts, will show you how to performance tune a SQL Server using miniDBA, from the highest level right down to individual SQL batches in databases. Obviously this is a huge area and this document is a framework to give you structure as to what actions you take, in what order. It contains links to a host of other more detailed pages on this site and also external articles. As more articles are added this document will grow organically to reference them.
There are 2 real world scenario when performance tuning occurs, either when there is a specific problem with a particular piece of code or when a server is seen as more generally slow. If the latter then work through this guide, checking and tuning every aspect. If there is a specific problem then just jump to relevant part of the documentation.
As a pre-requisit miniDBA should be installed, (Get it here) and the have a valid login the the SQL Server that needs to be tuned. The fully functional demo can be used to work along with this guide and is encouraged as the guide will give you the opportunity to use all of the functionality of the application.
The details of the server dashboard are covered in the product documentation . the immediate benefit of this dashboard is the ability to identify anomalies visually using the graphs which cover most areas of the servers workings.
The below screenshot shows a server under little load with hardly any CPU load history but it can be seen that several new connections have just been made, a lot of extra buffer memory has just been used with a small amount of activity across indexes, disk & network.
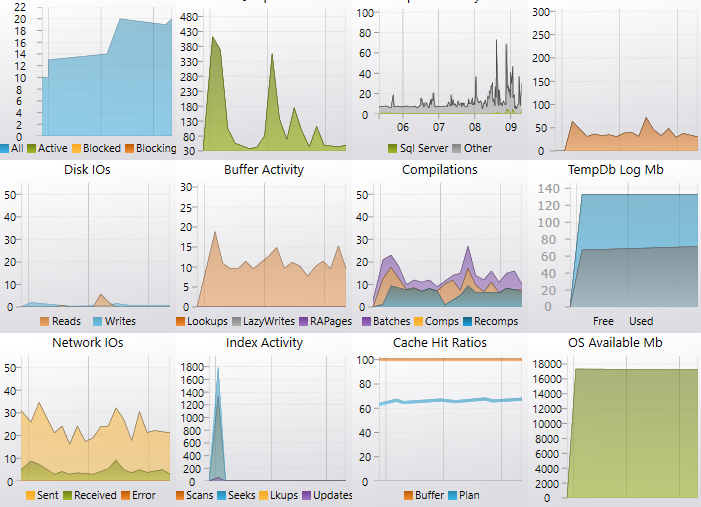
If your server shows any peaking graphs such as very high CPU or disk then this is the point you can prioritise the need to fix that problem first and go to the part of the documentation that covers that area.
Useful things to look out for here are:
- Blocking connections - these can't be totally avoided but can be reduced
- Non SQL Cpu history - the grey line shows any other processes on the server, this should be very low (Anti-virus scanners not welcome here)
- Disk reads - replacing disk reads with buffer reads where possible will speed up queries
- Index Scans - queries are a lot faster when they seek instead of scan
- Backups - IO may be impacted during backups
- Reserved memory - excess requests for reserved memory can cause any batches that want to sort/group by to wait
As well as current alerts such as long running queries, blocking processes, CPU, memory and disk pressure the history tab will show you all alerts since miniDBA started monitoring the server.
Customize these alerts in the triggers tab with your own threshold parameters if you want to be alerted in non default situations.
This is a gold mine of information and a screen that has every chance of giving you some serious performance gains.
The below screenshot shows individual drive performance statistics currently showing a disk queue on the c drive. this in itself is not a bad thing but it lets you know which drives have the most activity.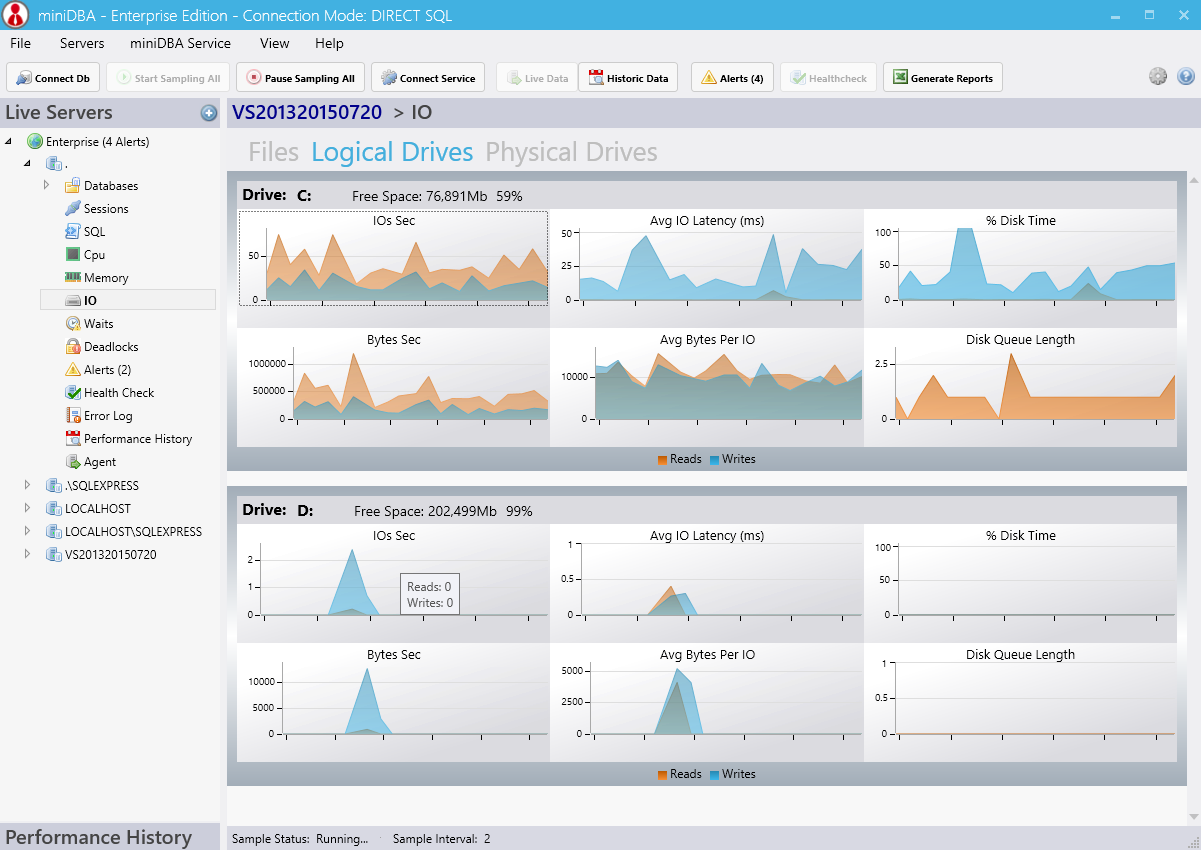
Average IO latency in milliseconds is a key indicator of slow reads and writes and should be checked for every drive.
Be sure to check the latency of every file on the Files tab, looking for particularly slow offenders (> 50ms is a good starting point)
The second insight is the Current tab, which unsurpringly displays only current waits, enabling you to see what the server is waiting for at the current time. This is more useful for troubleshooting performance issues that are occurring right now.
Aside from the ability to see historic and live waits the accumulating tab (screenshot below) gives you the ability to reset waits to zero and then watch them build up over time - if you have a problematic batch then reset this and then start your batch.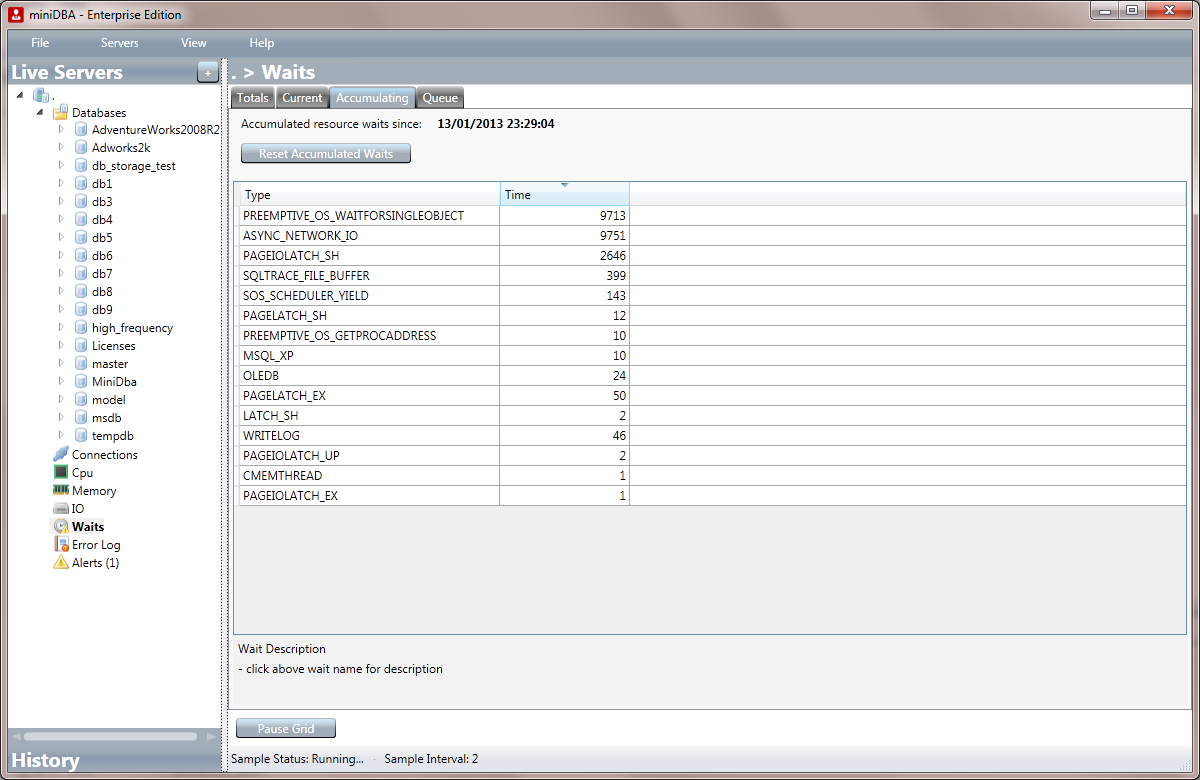
Continue to part 2...
There are 2 real world scenario when performance tuning occurs, either when there is a specific problem with a particular piece of code or when a server is seen as more generally slow. If the latter then work through this guide, checking and tuning every aspect. If there is a specific problem then just jump to relevant part of the documentation.
As a pre-requisit miniDBA should be installed, (Get it here) and the have a valid login the the SQL Server that needs to be tuned. The fully functional demo can be used to work along with this guide and is encouraged as the guide will give you the opportunity to use all of the functionality of the application.
Check Current Server Activity
The first place to start is by getting a feel for what load the server is currently under. Note:- analysing performance trends over time will come later and miniDBA saves performance data for later analysis as soon as it connects to a server.The details of the server dashboard are covered in the product documentation . the immediate benefit of this dashboard is the ability to identify anomalies visually using the graphs which cover most areas of the servers workings.
The below screenshot shows a server under little load with hardly any CPU load history but it can be seen that several new connections have just been made, a lot of extra buffer memory has just been used with a small amount of activity across indexes, disk & network.
If your server shows any peaking graphs such as very high CPU or disk then this is the point you can prioritise the need to fix that problem first and go to the part of the documentation that covers that area.
Useful things to look out for here are:
- Blocking connections - these can't be totally avoided but can be reduced
- Non SQL Cpu history - the grey line shows any other processes on the server, this should be very low (Anti-virus scanners not welcome here)
- Disk reads - replacing disk reads with buffer reads where possible will speed up queries
- Index Scans - queries are a lot faster when they seek instead of scan
- Backups - IO may be impacted during backups
- Reserved memory - excess requests for reserved memory can cause any batches that want to sort/group by to wait
Check Alerts
The alerts screen will tell you what alerts are currently being raised and what triggered them. If you have a current performance problem but are unsure of the nature of it then this is a useful screen to early on.As well as current alerts such as long running queries, blocking processes, CPU, memory and disk pressure the history tab will show you all alerts since miniDBA started monitoring the server.
Customize these alerts in the triggers tab with your own threshold parameters if you want to be alerted in non default situations.
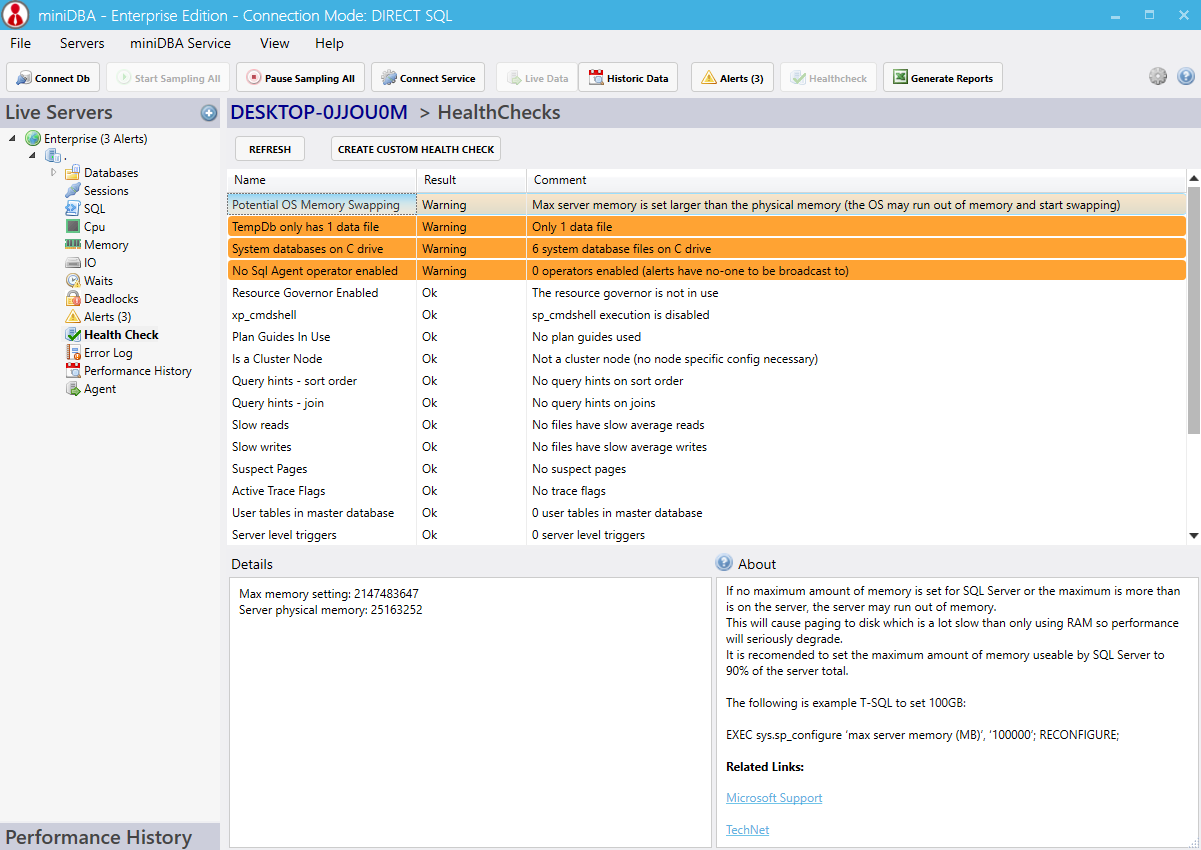
High level health check
The Server Healthcheck will analyse the SQL server for potential configuration and code optimizations. There is a vast amount of information potentially available here, work through each warning point and make sure you either take action or understand the implications of leaving it unfixed.
This is a gold mine of information and a screen that has every chance of giving you some serious performance gains.
IO
The IO Screen shows you the current performance and load of your IO subsystem. This is possibly the number 1 offender for a seemingly "slow server" outside of the database engine itself. Misconfigured files & drives effect on performance should never be under-estimated.The below screenshot shows individual drive performance statistics currently showing a disk queue on the c drive. this in itself is not a bad thing but it lets you know which drives have the most activity.
Average IO latency in milliseconds is a key indicator of slow reads and writes and should be checked for every drive.
Be sure to check the latency of every file on the Files tab, looking for particularly slow offenders (> 50ms is a good starting point)
Server Wait Statistics
The waits screen gives you 2 insights for the price of 1. Firstly the Total tab tells you the most waited for non system wait types since the server was last restarted. This is a great picture of the waits over time and a key indicator to the operational nature of the server. Look for particularly high wait types and use the description text box at the bottom of the screen to help understand what it means.The second insight is the Current tab, which unsurpringly displays only current waits, enabling you to see what the server is waiting for at the current time. This is more useful for troubleshooting performance issues that are occurring right now.
Aside from the ability to see historic and live waits the accumulating tab (screenshot below) gives you the ability to reset waits to zero and then watch them build up over time - if you have a problematic batch then reset this and then start your batch.
Continue to part 2...