Server Dashboard
Activity
Live Query Statistics
Profiler
Server Memory
Waits
Error Log
Cpu
IO
SQL Queries
Healthcheck
Databases
Database
Tables/Partitions
Index Use
Index Fragmentation
Files
Locks
Memory
SQL Queries
Default Trace
Transaction Log
Healthcheck
Execution Plan View
Index Maintenance
Manual Index Analysis
Index Defragmentation Jobs
Alerts
Configuration
Slack Integration
Teams Integration
Custom SQL Alerts
Maintenance Windows
SQL Server Alerts List
The 2 tabs give physical and logical usage. The difference is physical counters will contain the sum of all logical partitions on the drive.
Logical counters will only show values for the logical partition and not for the entire disk.
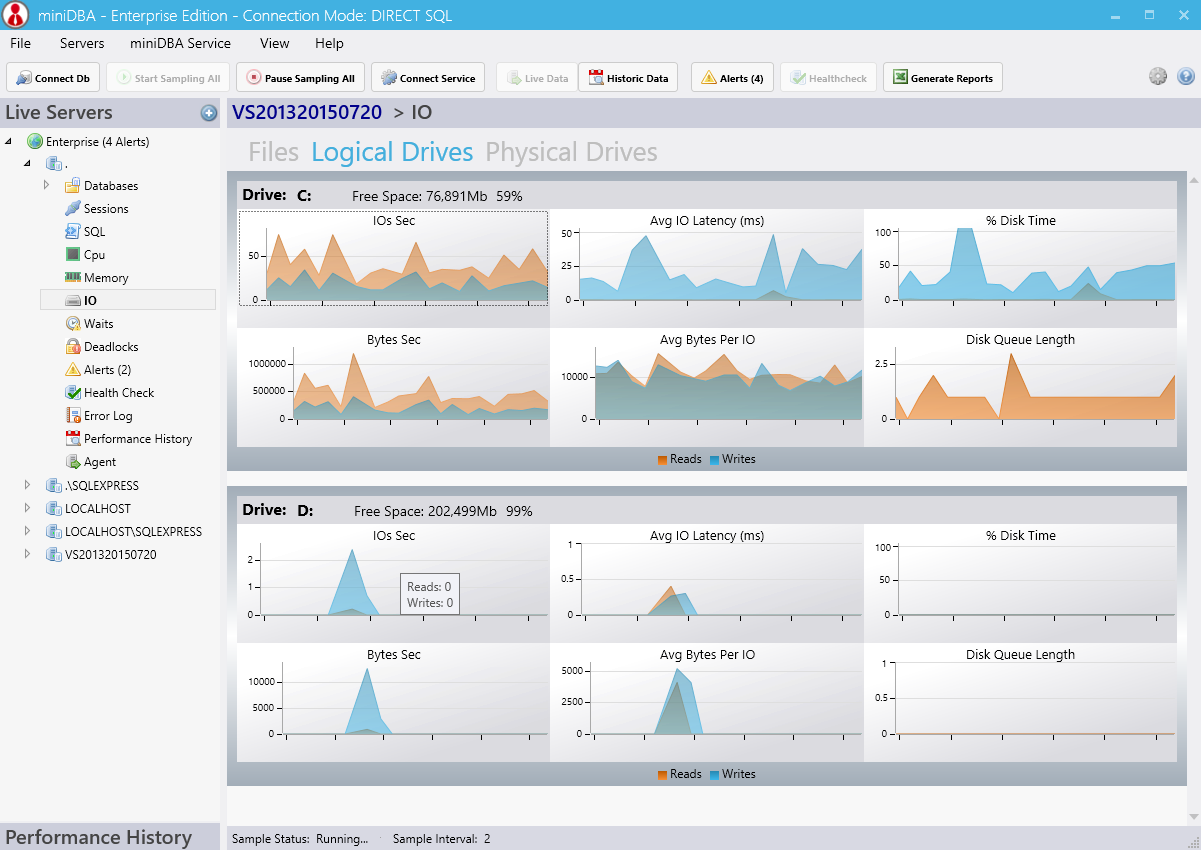
IO usage is displayed per attached drive. Each drive has its own set of graphs:
IOs sec - IO operations performed per second
Bytes Sec - Bytes transfered through IO per second
Avg IO Latency (ms) - Average time that it takes to complete a single I/O operation
Avg Bytes Per IO - (Bytes per second / IOs second)
% Disk Time - the % of the disks time being used (this may go over 100% owing to the way windows sums multiple operations in the same sample interval)
Disk Queue Length - the number of processes that are waiting to use the hard disk
To troubleshoot perfmon connectivity visit this link
Logical counters will only show values for the logical partition and not for the entire disk.
IO usage is displayed per attached drive. Each drive has its own set of graphs:
IOs sec - IO operations performed per second
Bytes Sec - Bytes transfered through IO per second
Avg IO Latency (ms) - Average time that it takes to complete a single I/O operation
Avg Bytes Per IO - (Bytes per second / IOs second)
% Disk Time - the % of the disks time being used (this may go over 100% owing to the way windows sums multiple operations in the same sample interval)
Disk Queue Length - the number of processes that are waiting to use the hard disk
Not Connecting To Performance Monitor
MiniDBA is dependent on conncting to the SQL Server's built in performance monitor counters. If the it says it is unable to connect then this screen will not have sample data available.To troubleshoot perfmon connectivity visit this link