Server Dashboard
Activity
Live Query Statistics
Profiler
Server Memory
Waits
Error Log
Cpu
IO
SQL Queries
Healthcheck
Databases
Database
Tables/Partitions
Index Use
Index Fragmentation
Files
Locks
Memory
SQL Queries
Default Trace
Transaction Log
Healthcheck
Execution Plan View
Index Maintenance
Manual Index Analysis
Index Defragmentation Jobs
Alerts
Configuration
Slack Integration
Teams Integration
Custom SQL Alerts
Maintenance Windows
SQL Server Alerts List
Use the profiler view (which uses light weight extended events) to see real time events on your server/database.
Existing sessions are visible, Mini DBA also creates 2 sessions of it's own, one to monitor for slow queries and one to monitor deadlocks/errors.
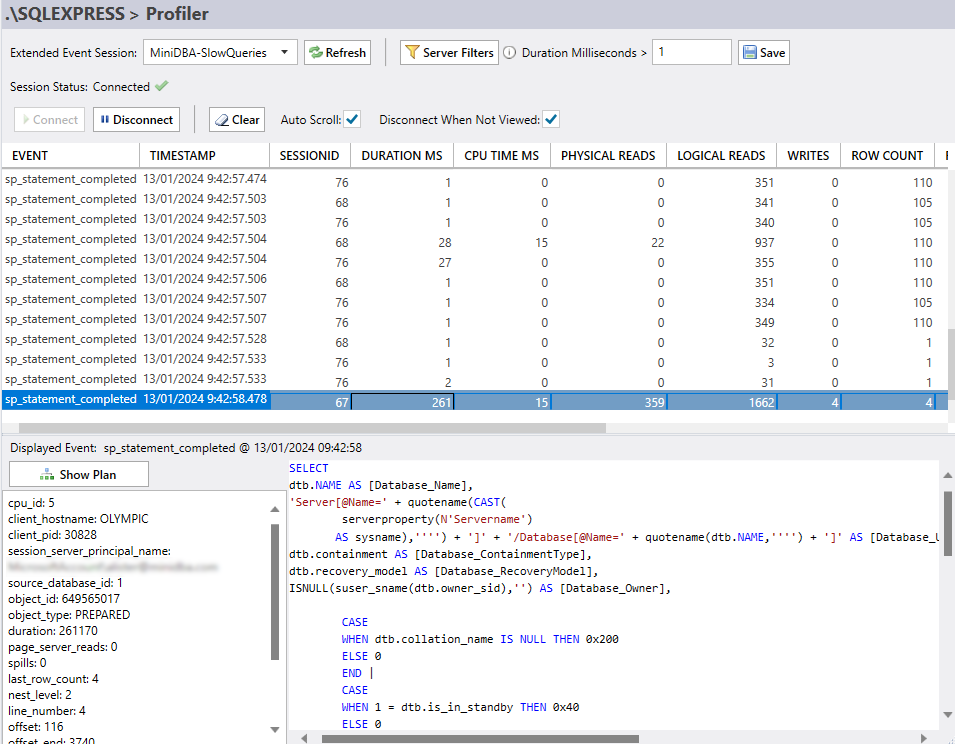
The profiler view is a great way to see what is happening on your server in real time. It is also a great way to learn about extended events.
Once you have selected a session to connect to from the top drop down list, the events will populate the main grid. You can click each event to see its details below.
The options are designed to consume the least reasonable reasources while still capturing the most important events.
This session is designed to be left running all the time. It is not designed to be used for performance tuning, it is designed to capture events that may indicate a problem. It feeds data into the deadlock view and generates alerts.
The UI gives you an extra shortcut filter option when selecting this session. You can filter by duration in milliseconds.

Depending on how small you set the duration milliseconds filter, you may see a lot of events. This is OK as the sp_statement_completed event has practically zero overhead; 0 microsecond average performance overhead when using sp_statement_completed: Jonathan Kehayias article
This session gives an extra option to stop the session when not viewing this screen. This gives you the option to either leave the session accumulating events or to not consume any resources at all on the server.

Another reason this event has extra low overhead is the fact the SQL query text is not captured. Only when you select an event in the grid will the query text be retreived from the server. This is done to reduce the amount of data being sent over the network for every event. Similarly the query plan is not captured either, it is only retrieved when you click the execution plan button.
You can use the execution plan button to see the execution plan for the query:
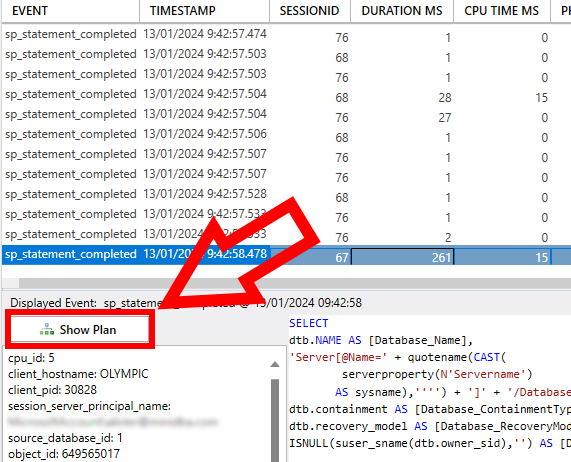
This is a feature that tools like SQL Server Management Studio do not offer. They make you include the execution plan in the event session which can cause a lot of overhead.
Mini DBA only retrieves the execution plan when you click the button and pops up the standard execution plan viewer. This is available for any extended events session that includes the plan_handle and sp_statement_completed not just the Mini DBA sessions.
Existing sessions are visible, Mini DBA also creates 2 sessions of it's own, one to monitor for slow queries and one to monitor deadlocks/errors.
The profiler view is a great way to see what is happening on your server in real time. It is also a great way to learn about extended events.
Once you have selected a session to connect to from the top drop down list, the events will populate the main grid. You can click each event to see its details below.
MiniDBA-QueryIssues
This session is created to monitor for queries with problems. It is created with the following events:- database_xml_deadlock_report
- additional_memory_grant
- execution_warning
- latch_suspend_warning
- lock_deadlock
- lock_deadlock_chain
- lock_timeout_greater_than_0
- server_memory_change
- xml_deadlock_report
The options are designed to consume the least reasonable reasources while still capturing the most important events.
WITH(MAX_MEMORY = 4096 KB, EVENT_RETENTION_MODE = ALLOW_MULTIPLE_EVENT_LOSS, MAX_DISPATCH_LATENCY = 30 SECONDS, MAX_EVENT_SIZE = 0 KB, MEMORY_PARTITION_MODE = NONE, TRACK_CAUSALITY = OFF, STARTUP_STATE = OFF)
This session is designed to be left running all the time. It is not designed to be used for performance tuning, it is designed to capture events that may indicate a problem. It feeds data into the deadlock view and generates alerts.
MiniDBA-SlowQueries
This session is created to monitor for slow queries. It is created with a single event: sp_statement_completedThe UI gives you an extra shortcut filter option when selecting this session. You can filter by duration in milliseconds.
Depending on how small you set the duration milliseconds filter, you may see a lot of events. This is OK as the sp_statement_completed event has practically zero overhead; 0 microsecond average performance overhead when using sp_statement_completed: Jonathan Kehayias article
This session gives an extra option to stop the session when not viewing this screen. This gives you the option to either leave the session accumulating events or to not consume any resources at all on the server.
Another reason this event has extra low overhead is the fact the SQL query text is not captured. Only when you select an event in the grid will the query text be retreived from the server. This is done to reduce the amount of data being sent over the network for every event. Similarly the query plan is not captured either, it is only retrieved when you click the execution plan button.
You can use the execution plan button to see the execution plan for the query:
This is a feature that tools like SQL Server Management Studio do not offer. They make you include the execution plan in the event session which can cause a lot of overhead.
Mini DBA only retrieves the execution plan when you click the button and pops up the standard execution plan viewer. This is available for any extended events session that includes the plan_handle and sp_statement_completed not just the Mini DBA sessions.