Mini DBA PostgreSQL monitoring helps DBAs review activity, databases, queries, waits, memory, I/O, indexes, permissions, logs, health checks, alerts, deadlocks, settings, and performance tuning for PostgreSQL servers.
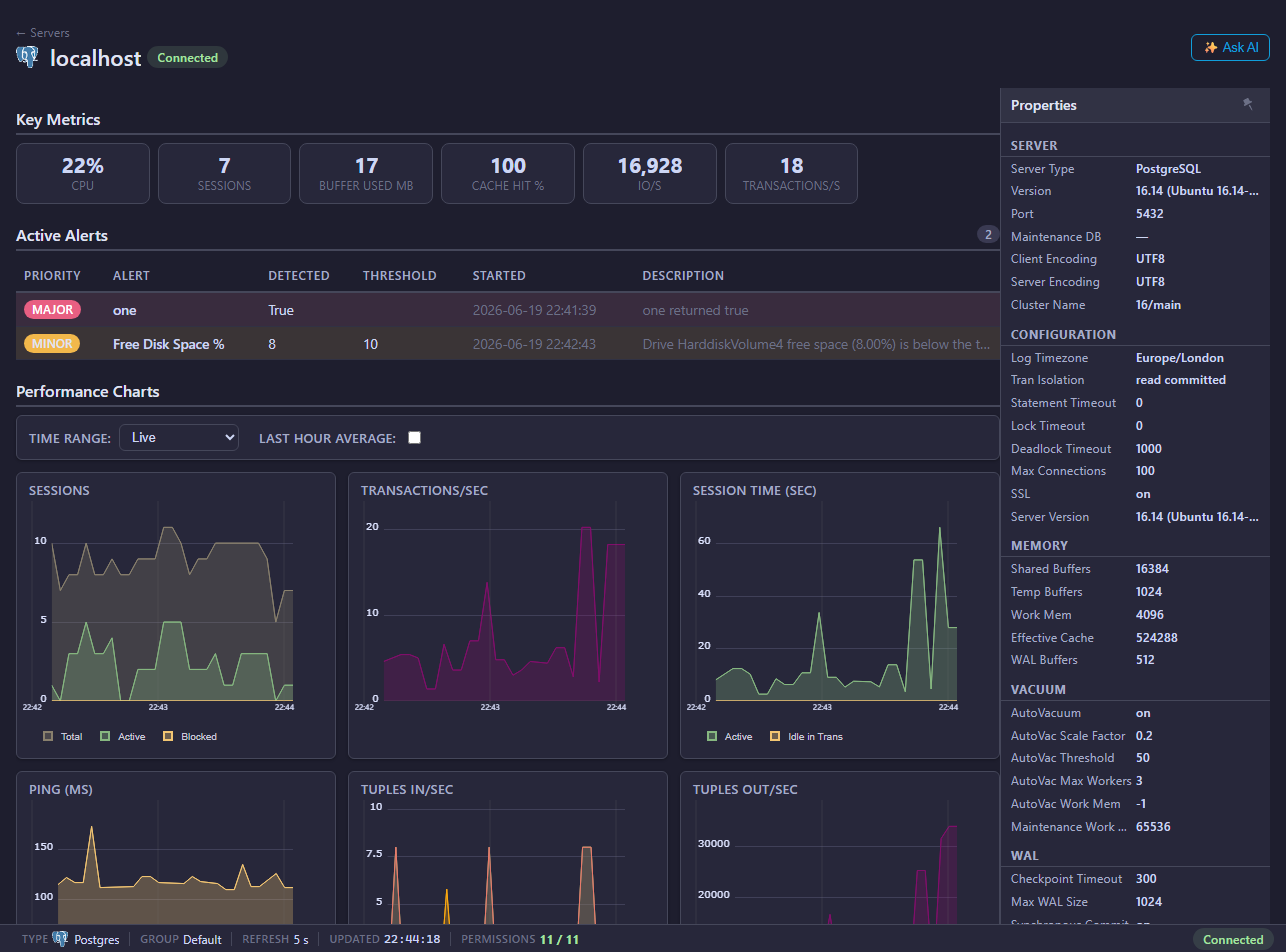
PostgreSQL Pages
- Connection and permissions
- Activity
- Databases
- Queries
- Execution Plans
- Waits
- Memory
- I/O
- Indexes
- Deadlocks
- Server Log
- Settings
- Permissions
- Health Checks
- Performance Tune
- Alerts
What PostgreSQL Monitoring Helps Answer
PostgreSQL monitoring in Mini DBA helps answer:
- Which sessions are active, waiting, blocked, or long-running?
- Which queries consume the most time or resources?
- Are waits pointing to locks, I/O, CPU, client behavior, or other PostgreSQL wait events?
- Are indexes helping the workload, or are table scans and index usage patterns a concern?
- Are PostgreSQL settings aligned with the workload?
- Are server logs showing deadlocks, slow statements, or operational errors?
- Is host CPU, memory, or disk I/O contributing to poor PostgreSQL performance?
PostgreSQL visibility depends heavily on roles and extensions. pg_stat_statements, pg_buffercache, file_fdw, monitoring roles, and host OS login can all improve what Mini DBA can explain.
Common Investigation Flow
- Start with Activity for current sessions and blocking.
- Use Queries for expensive statements.
- Use PostgreSQL Execution Plans to review plan text, diagrams, and AI plan analysis.
- Use Waits, I/O, and Memory for resource bottlenecks.
- Use Indexes and Performance Tune for tuning.
- Use Health Checks and Server Log for operational risk.
Live And Historical Overview Data
The PostgreSQL overview charts include the Mini DBA Time Range selector. Use Live for current push updates, or switch to Last Hour, Last 12 Hours, Last Day, Last Week, or Custom to review collected history. Mini DBA loads and caches the selected historical dataset for the current console session and server context, so moving between overview charts, activity, waits, and other historical views stays quick after the range has loaded. Use Back to Live to resume live updates, then select another historical range when you need a different point-in-time view.
Permissions, Extensions, And Logs
For production monitoring, create a dedicated PostgreSQL monitoring user with roles such as pg_monitor, pg_read_all_settings, pg_read_all_stats, pg_stat_scan_tables, and pg_read_server_files where your policy permits. Enable pg_stat_statements for query statistics and pg_buffercache for buffer cache insight. Configure PostgreSQL logging and file_fdw if you want Mini DBA to read PostgreSQL log events.
The PostgreSQL connection and permissions page includes SQL examples and setup notes. Use it before adding production PostgreSQL servers to Mini DBA.
PostgreSQL Monitoring FAQ
Does Mini DBA require PostgreSQL superuser?
No. Superuser is useful for testing, but routine monitoring should use narrower PostgreSQL roles and extensions.
Why is pg_stat_statements important?
It records query execution statistics. Without it, PostgreSQL query monitoring and tuning evidence is much weaker.
Can Mini DBA read PostgreSQL log files?
Yes, when PostgreSQL logging is configured and Mini DBA has the required server file access and file_fdw setup.
Why configure host OS login?
Host OS login adds Linux or Windows metrics such as CPU, memory, drive capacity, and disk I/O. These metrics help distinguish PostgreSQL query problems from host resource problems.
Related Pages
- Connect database servers
- PostgreSQL connection and permissions
- PostgreSQL execution plans
- Host OS login
- Alerts
- Reports