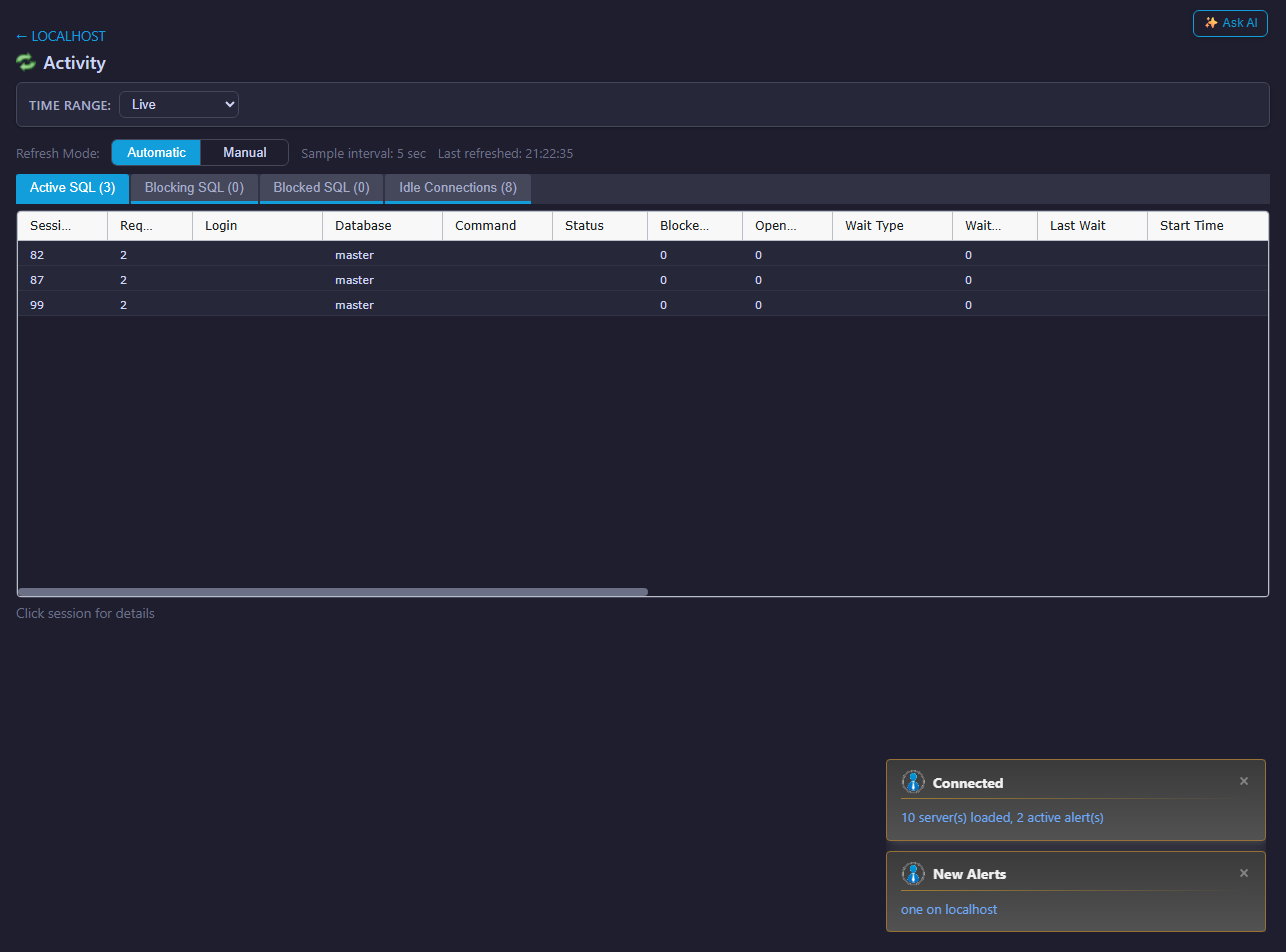
The SQL Server Activity page shows live workload and session information for a monitored SQL Server instance. Use it when you need to see what is running now.
What You Can Investigate
- Active sessions and requests.
- Login, database, command, and status.
- Blocking session IDs.
- Wait type and wait time.
- CPU, reads, writes, logical reads, elapsed time, and memory use.
- Program and host names.
- Current SQL text and related detail where available.
Workflow
- Open the SQL Server in the navigation tree.
- Select Activity.
- Sort by elapsed time, CPU, reads, waits, or blocking.
- Select a request for query detail.
- Open the execution plan from session detail where available and review SQL Server Execution Plans.
- Move to Cached SQL, Waits, or Profiler when deeper evidence is needed.
Live And Historical Activity
The SQL Server Activity page includes the Mini DBA Time Range selector. Use Live to watch current sessions, requests, blocking, and waits, or switch to Last Hour, Last 12 Hours, Last Day, Last Week, or Custom to review captured session history. Mini DBA loads and caches the selected historical activity dataset for the current console session and server context, so reviewing the loaded historical sessions and moving between related views stays quick. Use Back to Live to resume live updates, then choose another historical range when you need a different incident window.
How To Interpret SQL Server Activity
Start with the busiest and most blocked sessions, not simply the newest row. A session with high elapsed time and no progress may be waiting on a blocker, storage, memory grant, or external application behavior. A session with high CPU and logical reads may be a tuning candidate. A session with a blocking SPID should be investigated with the blocked and blocking workload in mind before taking action.
Activity is a point-in-time view. If the problem is intermittent, compare this page with SQL Server Query Store, Cached SQL, and SQL Server waits. Query Store gives historical context, cached SQL shows accumulated plan cache cost, and waits show the resource categories behind the workload.
When session detail includes an execution plan, use the plan viewer to drill into expensive operators, warnings, parameters, predicates, and missing index evidence. This is useful when a live request has high CPU, high reads, or a suspicious access pattern. The plan can also be passed to the AI Assistant for explanation and tuning recommendations.
SQL Server Activity FAQ
Why does the Activity page require VIEW SERVER STATE?
SQL Server exposes session, request, wait, and DMV data through views that require VIEW SERVER STATE. Without it, Mini DBA cannot show a complete live workload picture.
Should I kill a blocking session from this page?
Treat killing sessions as an operational decision. First identify the blocker, business process, transaction age, and query text. Use your change and incident process before terminating production sessions.
Why does a query show high reads but low CPU?
That pattern often points to I/O-heavy access patterns, scans, missing indexes, or reading more data than expected. Follow up in Cached SQL, Query Store, and Indexes.