Sql Server Query Optimizer
What is the Query Optimizer?
It decides on the execution plan to be used when a query is run. If this execution plan is sub optimal your query will continue to perform sub optimally. The execution plan is a best guess based on the schema and index statistics as the optimizer doesnt have time to evaluate all potential plans. The quality of the execution plan is only as good as the accuracy of the optimizer’s cost and cardinality estimations. If you don't have enough memory to keep all execution plans cached the optimizer will be run extremely often.
Even though it is extremely sophisticated the query plans it outputs are only as good as the information that is given to it. That is where miniDBA helps out by ensuring schema, T-SQL and environmental design and meta data are all as good as possible. The tools it provides help with this task and enable you to see performance benefits.
Ways To Help The Optimizer
- Check slow cached execution plans for problems in case the optimizer selected a plan based on a sub optimal query
- Ensure index statistics are up to date
- Ensure plan cache has enough memory to store most queries and run the query optimizer less often
- Ensure inappropriate query hints are not being used
- Ensure plans were not compiled based on parameters that don't acurately represent current parameters
Ways miniDBA helps you get more performance from the Optimizer:
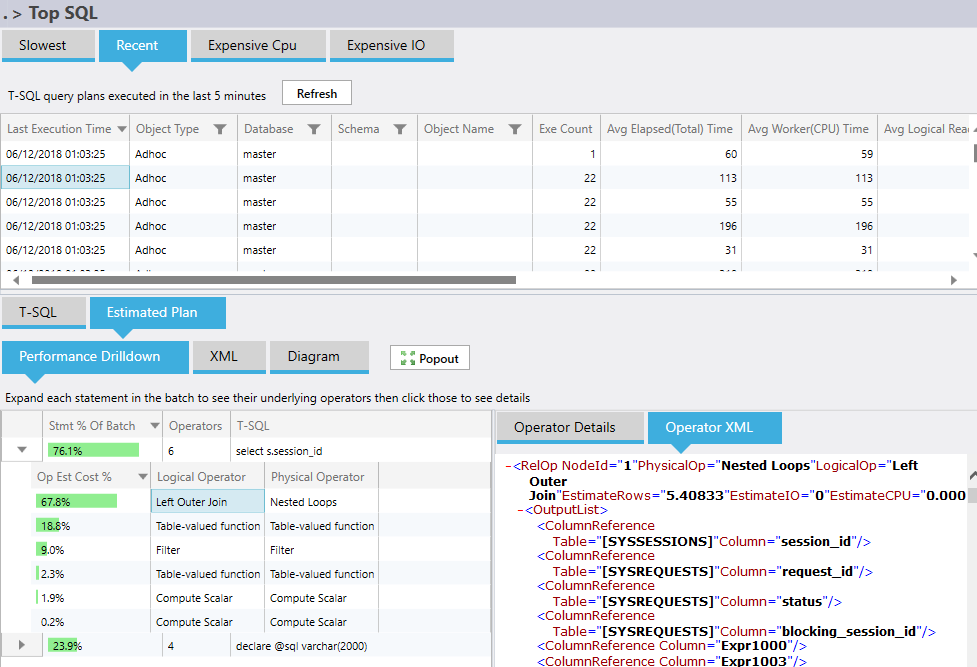
Execution Plan Analysis
- View execution plans that have been selected by the query optimizer and quickly identify any issues
- SQL execution plans broken down and ordered by expensive operators
- No more tracking back 'thick lines' in graphical execution plans (graphical plans available in the app)
- See which statement in a batch is taking most time and then expand into which operator in the statement is the slowest
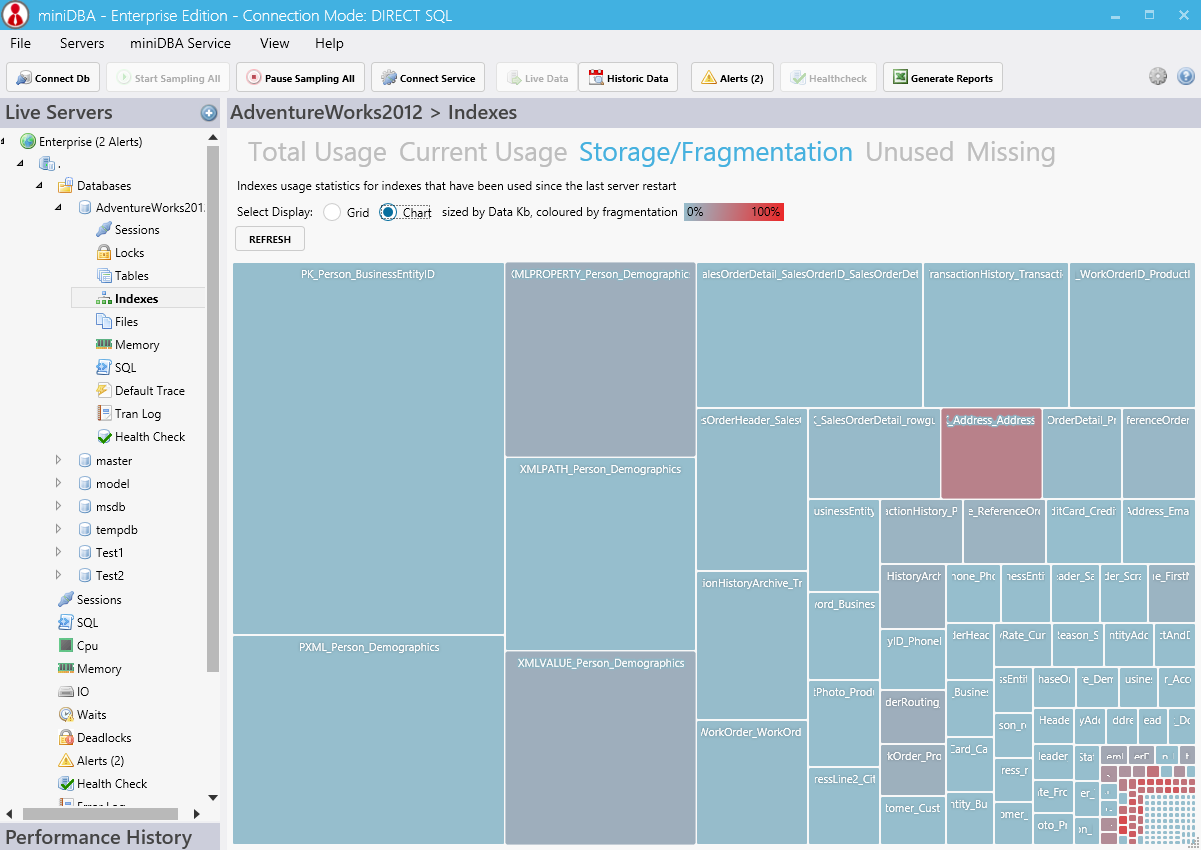
Index and Statistics Analysis
- See details of indexes that are used in execution plans
- Index Fragmentation is highlighted with unique heatmap of problems
- Quickly find the age of statistics that will effect execution plan selection
- Real-time index useage lets you watch what indexes are getting used as your query executes instead of what was expected to be used
- Use the Index Maintenance dashboard to rebuild fragmented indexes both straight away and as a scheduled job
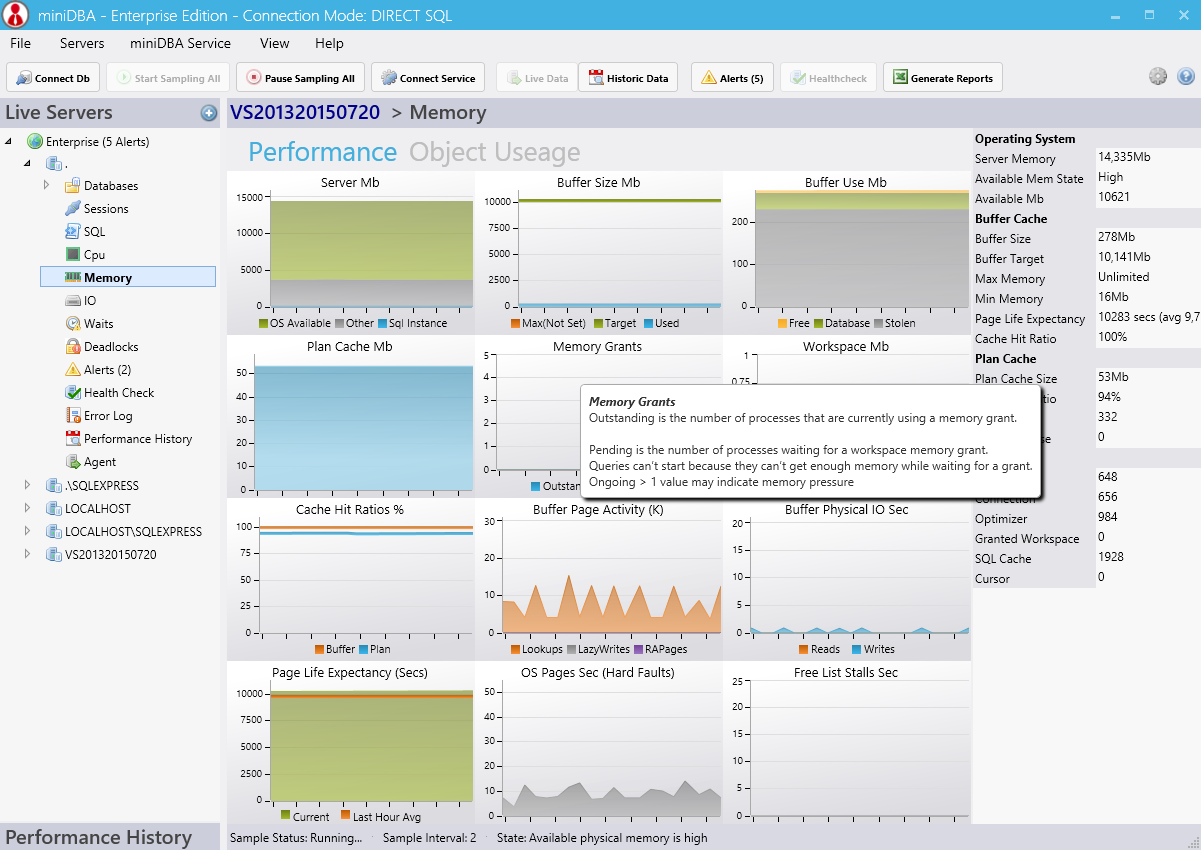
Cache Status
- The optimizer assumes that every query starts with a no cached data and it's data is will be read from disk, not from memory
- Buffer cache size and OS available metric graphs - see how data is in memory and how much more can fit in if needed
- Plan Cache Status - if the plan cache is full and plans are being generated old plans will get removed. This means when those queries are run again the optimizer will have to do more work to generate an execution plan. The plan cache size graph lets you know when there is no more growth.
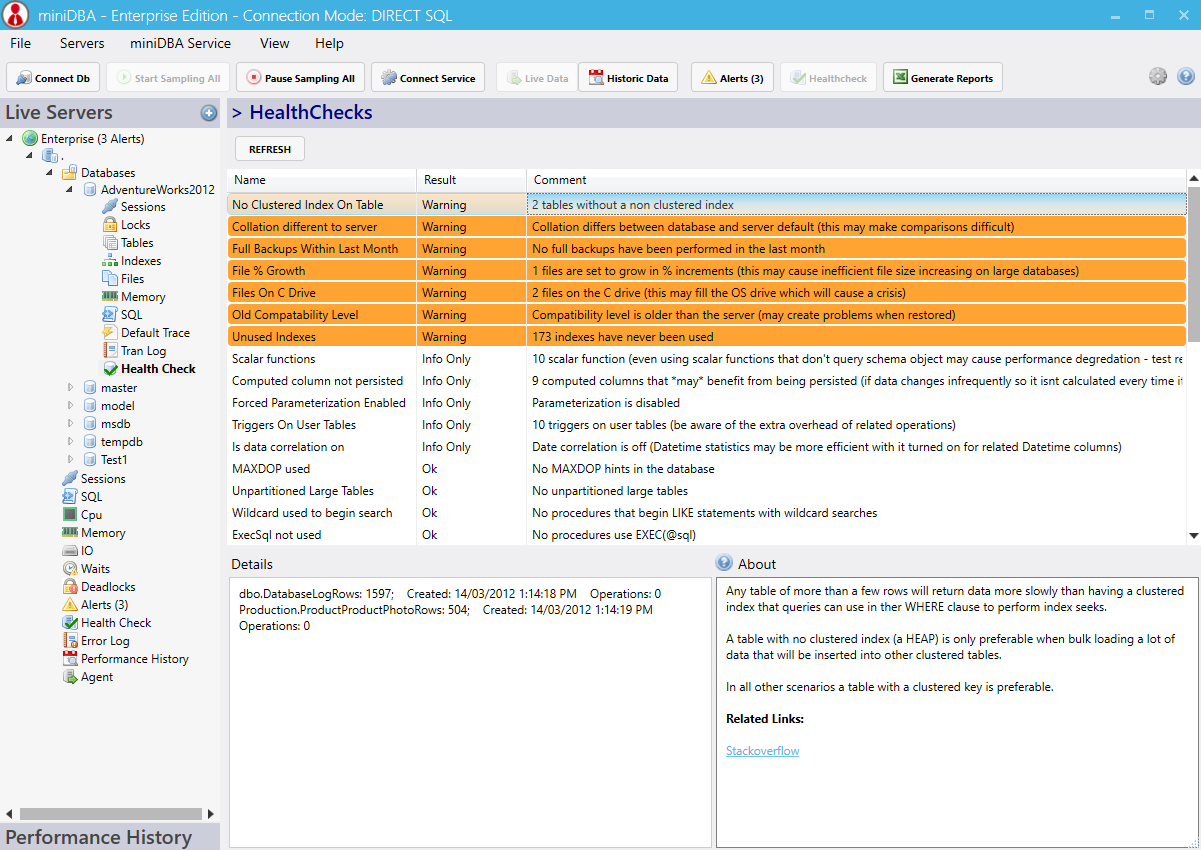
Query Hint Detection
- The optimizer lets you overide certain aspects of its functionality by using query hints in T-SQL code
- These can sometimes make the query perform worse than what the optimizer would produce
- Database health checks will scan code and detect any query hints in use, this in turn let's you experiment without them.
- This is especially usefull when a hint was used a long time ago and the data has changed a lot making the hint redundant/crippling.
Being able to find potentially slow query operators, out of date statistics and memory pressure almost instantly are key benefits of miniDBA.