Sql Server Alerts
Setup Alerts
Having timely alerts inform your team of changing SQL Server health is critical to every organization. Setting these up yourself requires substantial knowledge, development, implementation and testing time. MiniDBA aims to help you have comprehensive alerting setup without investing your time in the process.
MiniDBA provides 40+ alerts out of the box which cover all areas of SQL Server monitoring: sessions, memory, disk, cpu, deadlocks, agent jobs, Always On and much more. After registering a SQL Server with miniDBA, go to the Alerts screen for that server and under configure, view available alerts. Alerts are displayed by categories and expanding each one will show all under that category:
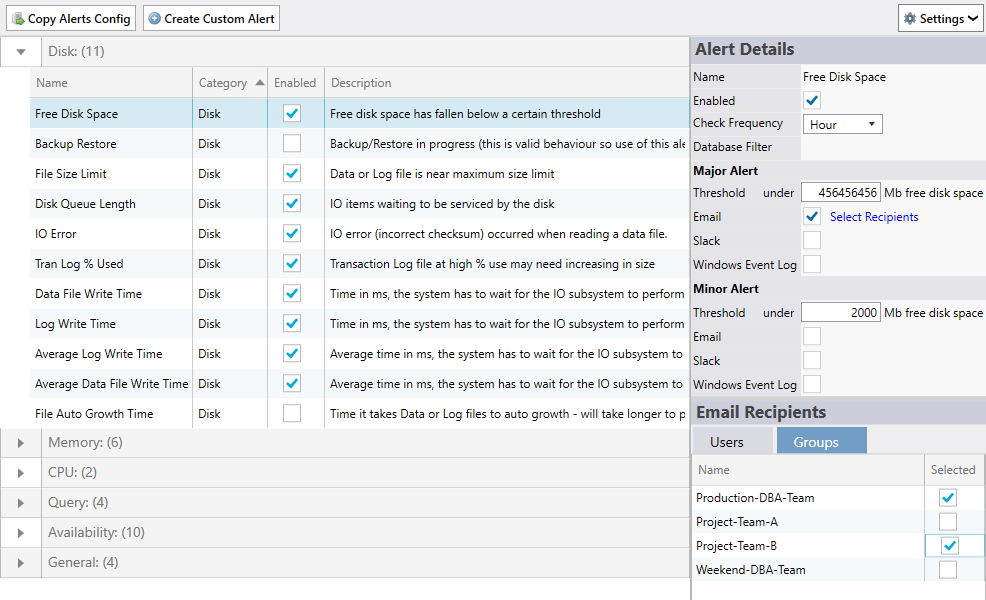
Enabling an alert is as simple as clicking the Enable check box and taking the default values. If you have never setup SQL Server alerts before then the default values can be a good starting point. Alert options are changeable after enabling it to either send you alerts more or less based on their threshold values.
Select an alert then review it's properties at the bottom of the screen. A description on the right of the properties tells you information about the alert. All other properties are shown for both major and minor priorities.
Copy Properties
If you have existing SQL Servers setup in miniDBA with alerts already setup you can copy these setting for your new server. Click the "Import Alerts Config" button at the top of the screen. This will give you the option to select a SQL Server to copy from. This will save you a lot of time if you have more extensive SQL Server estates.
Alert Priorities
All alerts have settings for both high and low priority. This allows you to differentiate between a potential emergency and just degraded performance. You do not have to use both priorities.
High and low come populated with different thresholds so they will fire at different times. You can set different notification settings for each allowing you to do things like only send emails on high alerts and send Slack notification for both high and low. If you want the high priority to notify when triggered but dont want low priority to, just set no threshold or an extreme value that will never be hit for low priority.
Notifications
miniDBA uses several ways to alert users when alerts fire:
- In App SQL Server - alerts are shown in the alerts node of a SQL Server on the left of the screen
- In App Global - alerts are shown for all SQL Servers in the Enterprise dashboard
- In App Windows Popup - alert popups are shown in the Windows system tray
- Windows Event Log - use this option to get alerts detected by Enterprise Management software like System Center Operations Manager (SCOM)
- Slack - send alerts to channels you configure. More Details
- Email - send to individual or groups, potentially different addresses depending on priority and use it to forward to apps like PagerDuty
Email is the most common external notification method used by miniDBA. Click the email address text field to see the extended email properties on the right of the screen. Below is a screenshot of the email configuration for an alert:
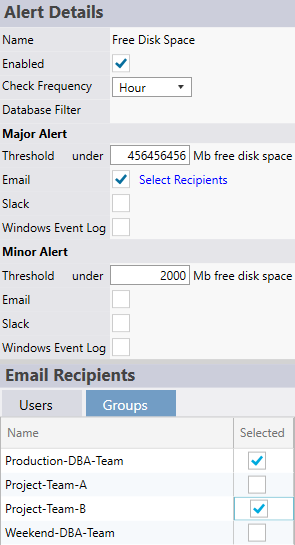
You enter one or many email addresses in the box at top right. Clicking save puts that value in either the high or low priority email address field, depending on what you clicked. Email addresses that are already used for alerts can be selected from the list below, saving you time.
The options drop down at the top of the screen gives you access to email SMTP server setup.
MiniDBA aims to give context to alerts where possible to help drill down to the root cause of the problem. It goes beyond just telling you what threshold value has been breached. For example with memory alerts a memory snapshot of the SQL Server is included such as in the example email below:
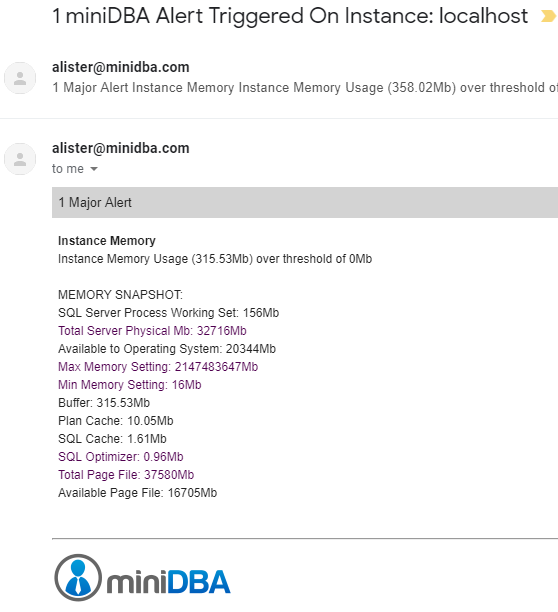
This is extendended also for any alerts that feature sessions like long running and blocking queries as a list of active sessions is always included in the alert email.
Available Alerts
The following are the alerts that can be raised by miniDBA for SQL Server - click each one for details
This may mean that the drive will fill completely and the server will not be able to function correctly
A degree of this is to be expected in busy environments as locks are taken out on objects
The MaxThreshold represents the number of blocking processes that it takes to trigger an alert
Processes deadlocked by other processes
Often caused by locks being held for too long, in turn caused by poor index design
Huge queries may be consuming way too much of the servers resources
The MaxThreshold represents number of minutes the batch must run to trigger the alert
This may indicate periods of very high use or inefficient client application code.
This can negatively effect database performance of any databases that share the same drive as the database being backed up.
Can often occur at unexpected times and require better scheduling
Either the file will autogrow which may impact performance during the operation or it will run out of space if set to have a size limit
Use this alert to tell you if the allocated memory is actually being used or not while tuning memory settings
Sustained high usage may indicate poor T-SQL or index design
Ideally there should be minimal activity by any non SQL Server processes on the server.
Check virus scanners and other maintenance software is configured correctly
High disk queue length can signify poor IO configuration.
Check if multiple databases sharing the same drive.
The thresholds are device dependant so experiment with the settings
No jobs will be able to run if the agent is not running
If the latest execution failed, it is raised as an alert
If this server is expected to have failing jobs then disable this alert
A full or near full transaction log may cause bad database performance and will likely have a run-away query with poor design causing it
Lower waiting times are better - the IO Ms is calculated across total stall ms / read & write operations, giving an average rather than an on the spot calculation
The figure is server wide not specific to any database and indicates a performance bottleneck around whichever drive the offending log file(s) are on
These levels of severity covers user correctable errors such as problems with High Availability Groups or queries that throw errors
Performance of the query can be affected because multiple passes over the data are required to sort the data
Avoid autogrowths by giving the files a larger, more appropriate maximum size